

一、安装Calico
1.在Master01节点上更改calico的网段
$ cd /root/k8s-ha-install/calico/
$ sed -i "s#POD_CIDR#172.16.0.0/12#g" calico.yaml
2.在Master01节点上验证calico的网段是否成功修改
$ grep "IPV4POOL_CIDR" calico.yaml  -A 1
            - name: CALICO_IPV4POOL_CIDR
              value: "172.16.0.0/12"
3.在Master01节点上安装calico
$ kubectl apply -f calico.yaml
4.在Master01节点上查看容器状态
$ kubectl get po -n kube-system
NAME                                       READY   STATUS    RESTARTS   AGE
calico-kube-controllers-6f6595874c-lgc47   1/1     Running   0          9m57s
calico-node-5pdrk                          1/1     Running   0          9m57s
calico-node-6zgnd                          1/1     Running   0          9m57s
calico-node-b4ktd                          1/1     Running   0          9m57s
calico-node-bkplf                          1/1     Running   0          9m57s
calico-node-rvnrq                          1/1     Running   0          9m57s
calico-typha-6b6cf8cbdf-llcms              1/1     Running   0          9m57s
二、安装CoreDNS
1.在Master01节点上将coredns的serviceIP改成k8s service网段的第十个IP
$ cd /root/k8s-ha-install/CoreDNS
$ COREDNS_SERVICE_IP=`kubectl get svc | grep kubernetes | awk '{print $3}'`0
$ sed -i "s#KUBEDNS_SERVICE_IP#${COREDNS_SERVICE_IP}#g" coredns.yaml
2.在Master01节点上安装coredns
$ cd /root/k8s-ha-install/CoreDNS
$ kubectl  create -f coredns.yaml
3.在Master01节点上查看容器状态
$ kubectl get po -n kube-system | grep coredns
coredns-5db5696c7-9m9s8                    1/1     Running   0          88s
三、安装Metrics Server
1.在Master01节点上安装metrics server
$ cd /root/k8s-ha-install/metrics-server
$ kubectl  create -f .
2.在Master01节点上查看metrics server状态
$ kubectl get po -n kube-system | grep metrics
metrics-server-6bf7dcd649-v7gqt            1/1     Running   0          2m23s
四、安装Dashboard
Dashboard 是基于网页的 Kubernetes 用户界面。 你可以使用 Dashboard 将容器应用部署到 Kubernetes 集群中,也可以对容器应用排错,还能管理集群资源。 你可以使用 Dashboard 获取运行在集群中的应用的概览信息,也可以创建或者修改 Kubernetes 资源 (如 Deployment,Job,DaemonSet 等等)。 例如,你可以对 Deployment 实现弹性伸缩、发起滚动升级、重启 Pod 或者使用向导创建新的应用。Dashboard 同时展示了 Kubernetes 集群中的资源状态信息和所有报错信息。
1.在Master01节点上安装Dashboard
$ cd /root/k8s-ha-install/dashboard/
$ kubectl  create -f .
2.在Master01节点上查看Dashboard状态
$ kubectl get po -n kubernetes-dashboard
NAME                                         READY   STATUS    RESTARTS   AGE
dashboard-metrics-scraper-7fcdff5f4c-p9cjq   1/1     Running   0          2m36s
kubernetes-dashboard-85f59f8ff7-zhbsd        1/1     Running   0          2m36s
3.在Master01节点上查看Dashboard服务
$ kubectl get svc -n kubernetes-dashboard
NAME                        TYPE        CLUSTER-IP     EXTERNAL-IP   PORT(S)         AGE
dashboard-metrics-scraper   ClusterIP   10.0.174.237   <none>        8000/TCP        2m52s
kubernetes-dashboard        NodePort    10.0.187.20    <none>        443:31846/TCP   2m52s
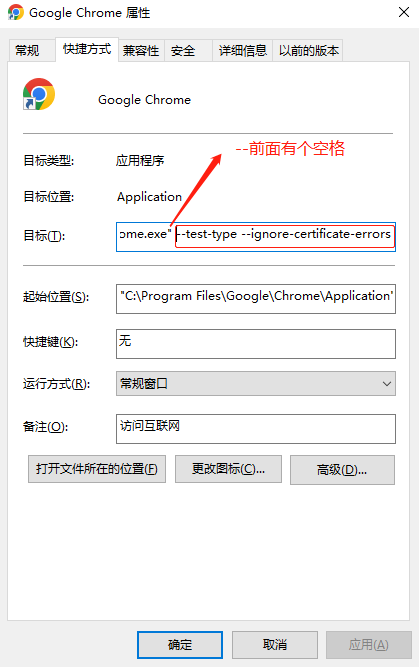
4.在谷歌浏览器(Chrome)启动文件中加入启动参数,用于解决无法访问Dashboard的问题
(1)右键谷歌浏览器(Chrome),选择【属性】
(2)在【目标】位置处添加下面参数,这里再次强调一下--test-type --ignore-certificate-errors前面有参数
--test-type --ignore-certificate-errors
5.在Master01节点上查看token值
$ kubectl -n kube-system describe secret $(kubectl -n kube-system get secret | grep admin-user | awk '{print $1}')
Name:         admin-user-token-98765
Namespace:    kube-system
Labels:       <none>
Annotations:  kubernetes.io/service-account.name: admin-user
              kubernetes.io/service-account.uid: 95a305e4-620d-4e0f-ab58-b50ee7cdabd6

Type:  kubernetes.io/service-account-token

Data
====
namespace:  11 bytes
token:      eyJhbGciOiJSUzI1NiIsImtpZCI6Ik52bDFLMFZUNEZiN3gybFFfTWxfM0hORDUzRHdPcm1wM2s5VjBOZ3YtYU0ifQ.eyJpc3MiOiJrdWJlcm5ldGVzL3NlcnZpY2VhY2NvdW50Iiwia3ViZXJuZXRlcy5pby9zZXJ2aWNlYWNjb3VudC9uYW1lc3BhY2UiOiJrdWJlLXN5c3RlbSIsImt1YmVybmV0ZXMuaW8vc2VydmljZWFjY291bnQvc2VjcmV0Lm5hbWUiOiJhZG1pbi11c2VyLXRva2VuLTk4NzY1Iiwia3ViZXJuZXRlcy5pby9zZXJ2aWNlYWNjb3VudC9zZXJ2aWNlLWFjY291bnQubmFtZSI6ImFkbWluLXVzZXIiLCJrdWJlcm5ldGVzLmlvL3NlcnZpY2VhY2NvdW50L3NlcnZpY2UtYWNjb3VudC51aWQiOiI5NWEzMDVlNC02MjBkLTRlMGYtYWI1OC1iNTBlZTdjZGFiZDYiLCJzdWIiOiJzeXN0ZW06c2VydmljZWFjY291bnQ6a3ViZS1zeXN0ZW06YWRtaW4tdXNlciJ9.LgPrPXX3kwVJUxk3HKARVjmxNZi5u5zwe8KUAg84OyZ_iknuUUKDo0drgHuj6lHIKcs4QAZVeK5ENplP7pFWV9KNTwPQzte7PdZFdbkyR-EppeWQwxPR_R_uYbMFXGCpUF9rOQQH2CzHSZLDMC_L66MqCyn973scLrbwnejZlg_r5vMj6e5t9b3qAKbD6jIqB-V0xtjUNllvxCg4YX7Z9q6tYntceA9AkMp1FMyVlxSeIh0VU7mLO97vClHAV0p3yI3EUwovKLrBN-LEE-Bb54QTG47G102nCJkYxVlC0MPprS6MkJL3LgxEBlhsjtBPyaBj73JtmbmGToWpD2nQ7Q
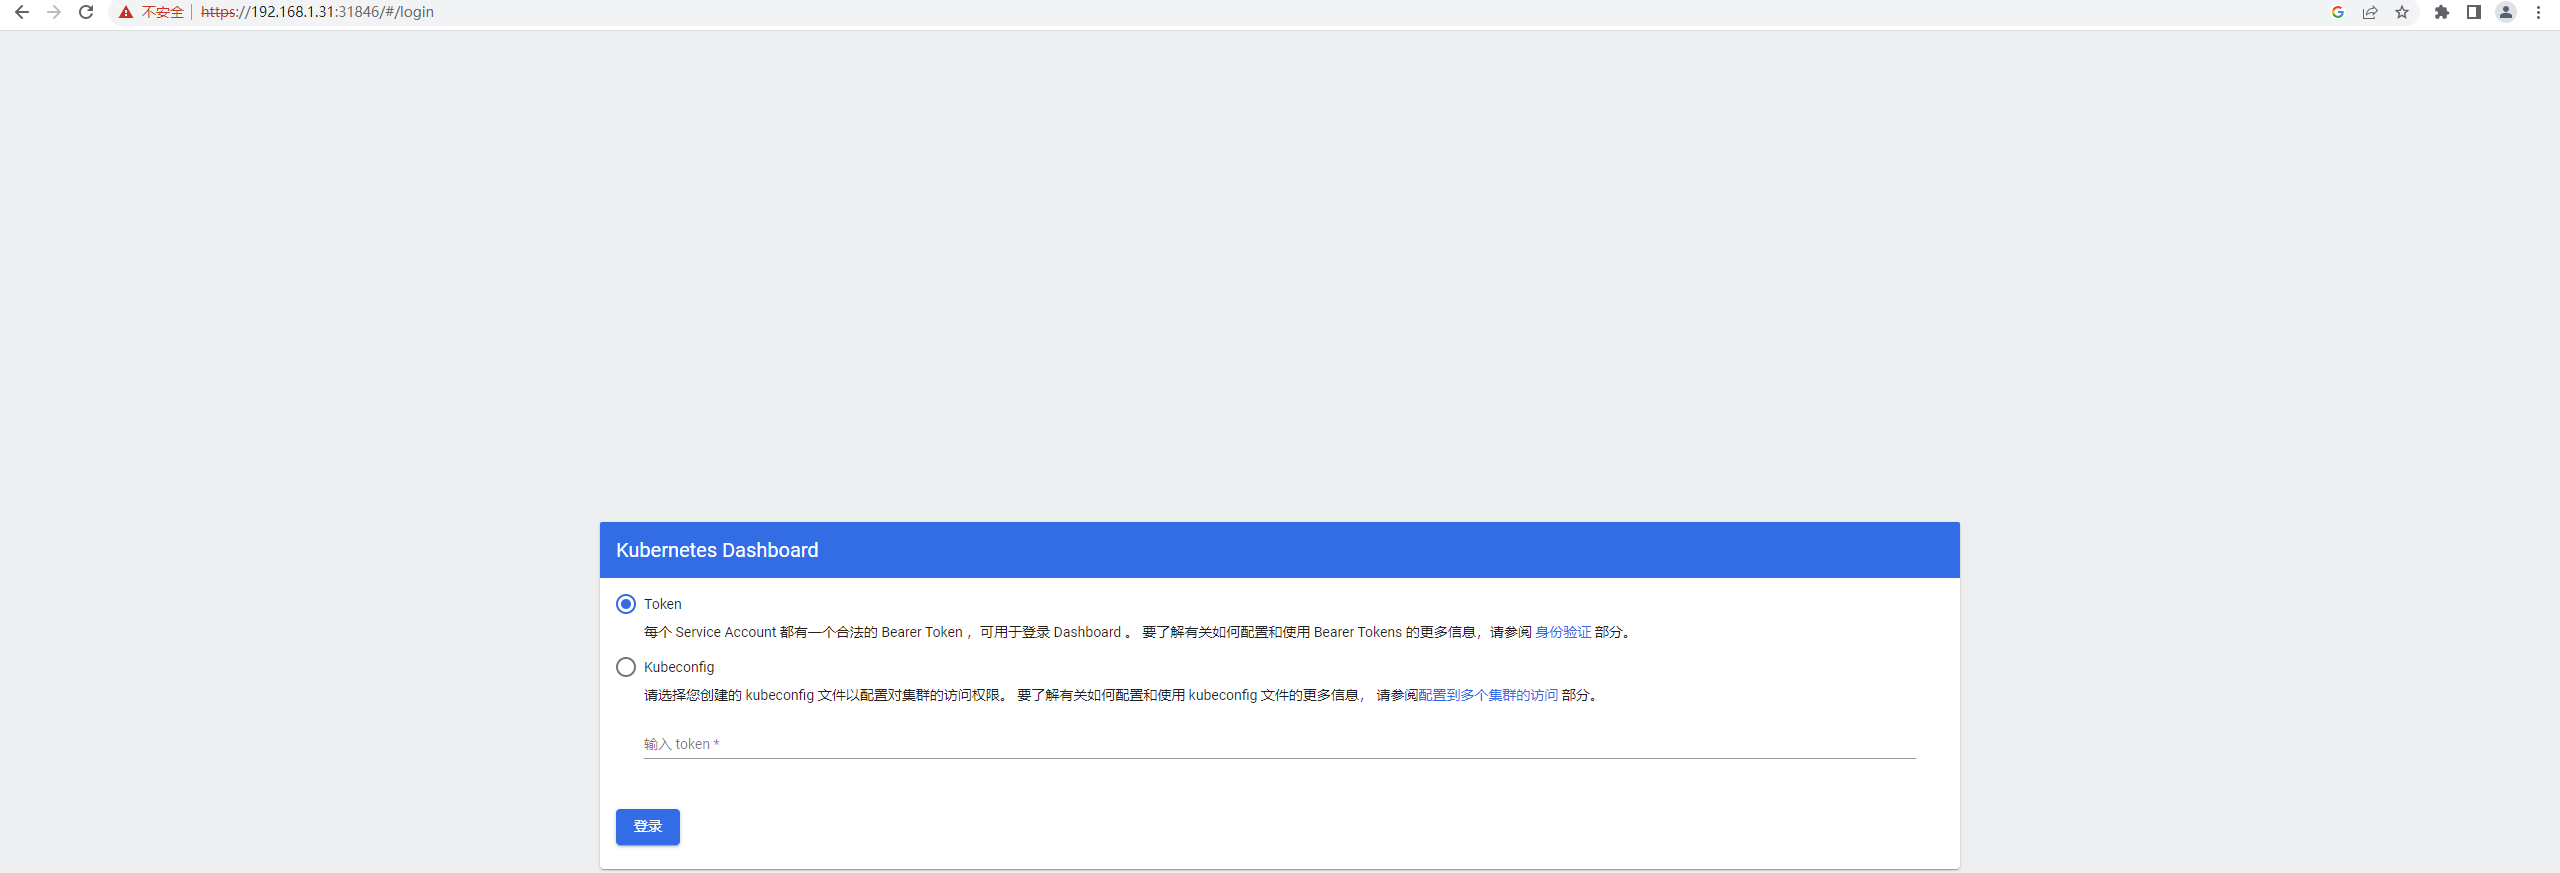
6.打开谷歌浏览器(Chrome),输入https://任意节点IP:服务端口,这里以Master01节点为例(如果访问失败,可参考k8s排错-Google浏览器打不开k8s中dashboard)
https://192.168.1.31:31846
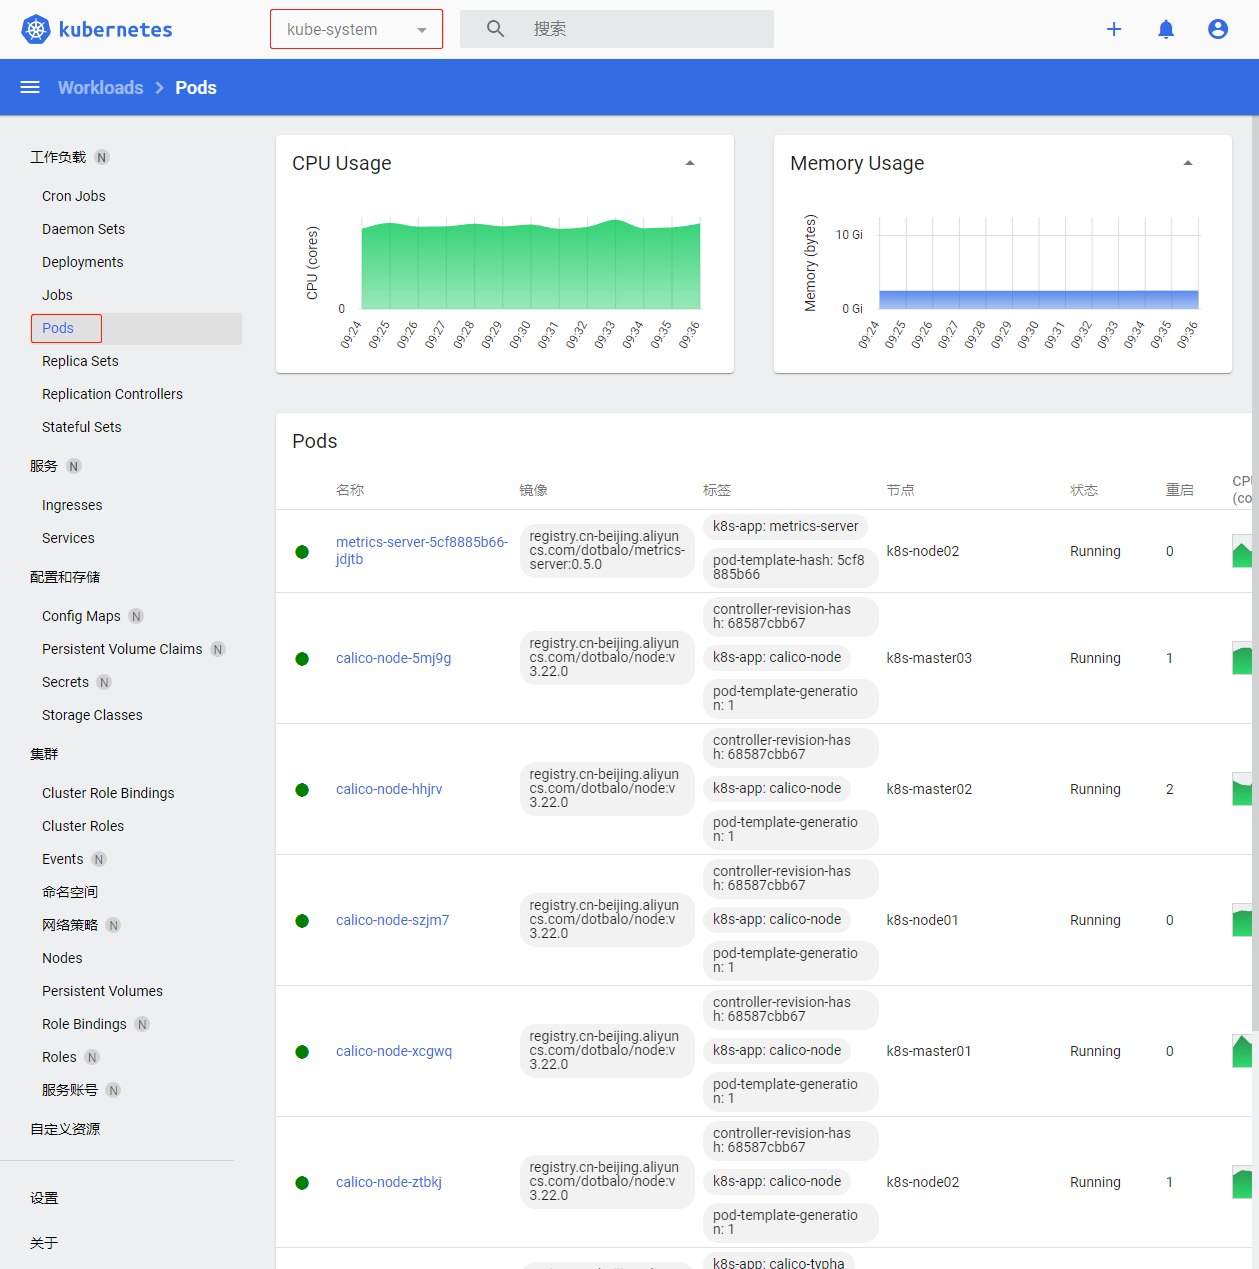
7.切换命名命名空间为kube-system,默认defult命名空间没有资源
五、Kubectl自动补全
1.在Master01节点上开启kubectl自动补全
source <(kubectl completion bash)
echo "source <(kubectl completion bash)" >> ~/.bashrc
2.在Master01节点上为 kubectl 使用一个速记别名
$ alias k=kubectl
$ complete -o default -F __start_kubectl k
六、集群可用性验证
1.在Master01节点上查看节点是否正常,确定都是Ready
$ kubectl get node
NAME           STATUS   ROLES    AGE    VERSION
k8s-master01   Ready    <none>   105m   v1.23.17
k8s-master02   Ready    <none>   105m   v1.23.17
k8s-master03   Ready    <none>   105m   v1.23.17
k8s-node01     Ready    <none>   105m   v1.23.17
k8s-node02     Ready    <none>   105m   v1.23.17
2.在Master01节点上查看所有Pod是否正常,确定READY都是N/N形式的且STATUS 都为Running
$ kubectl get pod -A
NAMESPACE              NAME                                         READY   STATUS    RESTARTS   AGE
kube-system            calico-kube-controllers-6f6595874c-lgc47     1/1     Running   0          83m
kube-system            calico-node-5pdrk                            1/1     Running   0          83m
kube-system            calico-node-6zgnd                            1/1     Running   0          83m
kube-system            calico-node-b4ktd                            1/1     Running   0          83m
kube-system            calico-node-bkplf                            1/1     Running   0          83m
kube-system            calico-node-rvnrq                            1/1     Running   0          83m
kube-system            calico-typha-6b6cf8cbdf-llcms                1/1     Running   0          83m
kube-system            coredns-5db5696c7-9m9s8                      1/1     Running   0          68m
kube-system            metrics-server-6bf7dcd649-v7gqt              1/1     Running   0          61m
kubernetes-dashboard   dashboard-metrics-scraper-7fcdff5f4c-p9cjq   1/1     Running   0          56m
kubernetes-dashboard   kubernetes-dashboard-85f59f8ff7-gxmp7        1/1     Running   0          22m
3.在Master01节点上查看集群网段是否冲突
(1)在Master01节点上查看SVC网段
$ kubectl get svc
NAME         TYPE        CLUSTER-IP   EXTERNAL-IP   PORT(S)   AGE
kubernetes   ClusterIP   10.0.0.1     <none>        443/TCP   155m
(2)在Master01节点上查看POD网段,主要分为两段,一段是因为使用HostNetwork,所以使用宿主机网段;另一段使用POD网段
$ kubectl get po -A -owide
NAMESPACE              NAME                                         READY   STATUS    RESTARTS   AGE   IP               NODE           NOMINATED NODE   READINESS GATES
kube-system            calico-kube-controllers-6f6595874c-lgc47     1/1     Running   0          85m   172.27.14.193    k8s-node02     <none>           <none>
kube-system            calico-node-5pdrk                            1/1     Running   0          85m   192.168.1.35     k8s-node02     <none>           <none>
kube-system            calico-node-6zgnd                            1/1     Running   0          85m   192.168.1.32     k8s-master02   <none>           <none>
kube-system            calico-node-b4ktd                            1/1     Running   0          85m   192.168.1.33     k8s-master03   <none>           <none>
kube-system            calico-node-bkplf                            1/1     Running   0          85m   192.168.1.31     k8s-master01   <none>           <none>
kube-system            calico-node-rvnrq                            1/1     Running   0          85m   192.168.1.34     k8s-node01     <none>           <none>
kube-system            calico-typha-6b6cf8cbdf-llcms                1/1     Running   0          85m   192.168.1.35     k8s-node02     <none>           <none>
kube-system            coredns-5db5696c7-9m9s8                      1/1     Running   0          69m   172.24.92.65     k8s-master02   <none>           <none>
kube-system            metrics-server-6bf7dcd649-v7gqt              1/1     Running   0          63m   172.17.124.1     k8s-node01     <none>           <none>
kubernetes-dashboard   dashboard-metrics-scraper-7fcdff5f4c-p9cjq   1/1     Running   0          58m   172.24.244.193   k8s-master01   <none>           <none>
kubernetes-dashboard   kubernetes-dashboard-85f59f8ff7-gxmp7        1/1     Running   0          23m   172.18.194.1     k8s-master03   <none>           <none>
4.在Master01节点上查看是否正常创建资源
(1)在Master01节点上创建名为cluster-test的deployment
$ kubectl create deploy cluster-test --image=registry.cn-hangzhou.aliyuncs.com/zq-demo/debug-tools -- sleep 3600
(2)在Master01节点上查看deployment创建情况
$ kubectl kubectl get po
NAME                            READY   STATUS    RESTARTS      AGE
cluster-test-79b978867f-4x2lw   1/1     Running   8 (19m ago)   8h
5.在Master01节点上检查Pod 是否能够解析 Service
(1)在Master01节点上解析kubernetes,观察到和上面SVC地址一致
$ kubectl exec -it cluster-test-79b978867f-4x2lw -- bash
(23:59 cluster-test-79b978867f-4x2lw:/) nslookup kubernetes
Server:     10.0.0.10
Address:    10.0.0.10#53

Name:   kubernetes.default.svc.cluster.local
Address: 10.0.0.1
(2)在Master01节点上解析kube-dns.kube-system,观察到和上面SVC地址一致
$ kubectl exec -it cluster-test-79b978867f-4x2lw -- bash
(23:59 cluster-test-79b978867f-4x2lw:/) nslookup kube-dns.kube-system
Server:     10.0.0.10
Address:    10.0.0.10#53

Name:   kube-dns.kube-system.svc.cluster.local
Address: 10.0.0.10
6.每个节点是否能访问 Kubernetes 的 kubernetes svc 443 和 kube-dns 的 service 53
(1)在每台机器上测试访问 Kubernetes 的 kubernetes svc 443
$ curl https://10.0.0.1:443
curl: (60) Peer's Certificate issuer is not recognized.
More details here: http://curl.haxx.se/docs/sslcerts.html

curl performs SSL certificate verification by default, using a "bundle"
 of Certificate Authority (CA) public keys (CA certs). If the default
 bundle file isn't adequate, you can specify an alternate file
 using the --cacert option.
If this HTTPS server uses a certificate signed by a CA represented in
 the bundle, the certificate verification probably failed due to a
 problem with the certificate (it might be expired, or the name might
 not match the domain name in the URL).
If you'd like to turn off curl's verification of the certificate, use
 the -k (or --insecure) option.
(2)在每台机器上测试访问 Kubernetes 的kube-dns 的 service 53
$ curl 10.0.0.10:53
curl: (52) Empty reply from server
7.Pod 和机器之间是否能正常通讯
(1)在Master01节点上查看pod节点IP
$ kubectl get po -owide
NAME                            READY   STATUS    RESTARTS      AGE   IP             NODE           NOMINATED NODE   READINESS GATES
cluster-test-79b978867f-4x2lw   1/1     Running   8 (23m ago)   8h    172.24.92.67   k8s-master02   <none>           <none>
(2)在Master01节点上ping测试
$ ping -c 2 172.24.92.67
PING 172.24.92.67 (172.24.92.67) 56(84) bytes of data.
64 bytes from 172.24.92.67: icmp_seq=1 ttl=63 time=0.401 ms
64 bytes from 172.24.92.67: icmp_seq=2 ttl=63 time=0.188 ms

--- 172.24.92.67 ping statistics ---
2 packets transmitted, 2 received, 0% packet loss, time 1031ms
rtt min/avg/max/mdev = 0.188/0.294/0.401/0.107 ms
8.检查Pod 和Pod之间是否能正常通讯
(1)在Master01节点上查看default默认命名空间下的Pod
$ kubectl get po -owide
NAME                            READY   STATUS    RESTARTS      AGE   IP             NODE           NOMINATED NODE   READINESS GATES
cluster-test-79b978867f-4x2lw   1/1     Running   8 (23m ago)   8h    172.24.92.67   k8s-master02   <none>           <none>
(2)在Master01节点上kube-system命名空间下的Pod
$ kubectl get po -n kube-system -owide
NAME                                       READY   STATUS    RESTARTS   AGE   IP              NODE           NOMINATED NODE   READINESS GATES
calico-kube-controllers-6f6595874c-lgc47   1/1     Running   0          9h    172.27.14.193   k8s-node02     <none>           <none>
calico-node-5pdrk                          1/1     Running   0          9h    192.168.1.35    k8s-node02     <none>           <none>
calico-node-6zgnd                          1/1     Running   0          9h    192.168.1.32    k8s-master02   <none>           <none>
calico-node-b4ktd                          1/1     Running   0          9h    192.168.1.33    k8s-master03   <none>           <none>
calico-node-bkplf                          1/1     Running   0          9h    192.168.1.31    k8s-master01   <none>           <none>
calico-node-rvnrq                          1/1     Running   0          9h    192.168.1.34    k8s-node01     <none>           <none>
calico-typha-6b6cf8cbdf-llcms              1/1     Running   0          9h    192.168.1.35    k8s-node02     <none>           <none>
coredns-5db5696c7-9m9s8                    1/1     Running   0          9h    172.24.92.65    k8s-master02   <none>           <none>
metrics-server-6bf7dcd649-v7gqt            1/1     Running   0          9h    172.17.124.1    k8s-node01     <none>           <none>
(3)在Master01节点上进入cluster-test-79b978867f-429xg进行ping测试
$ kubectl exec -it cluster-test-79b978867f-4x2lw -- bash
(00:06 cluster-test-79b978867f-4x2lw:/) ping -c 2  192.168.1.33
PING 192.168.1.33 (192.168.1.33) 56(84) bytes of data.
64 bytes from 192.168.1.33: icmp_seq=1 ttl=63 time=0.575 ms
64 bytes from 192.168.1.33: icmp_seq=2 ttl=63 time=0.182 ms

--- 192.168.1.33 ping statistics ---
2 packets transmitted, 2 received, 0% packet loss, time 1006ms
rtt min/avg/max/mdev = 0.182/0.378/0.575/0.197 ms