
$ k run ng --image nginx:1.21.6
查看
$ k get po  | grep ng

ng                                       1/1     Running   0              14s
2、到pod里面安装vim,去配置一下status页
$ kubectl exec -it ng -- bash
root@ng:/# apt update
root@ng:/# apt install -y vim
3、在Pod里面编辑配置文件
$ kubectl exec -it ng -- bash
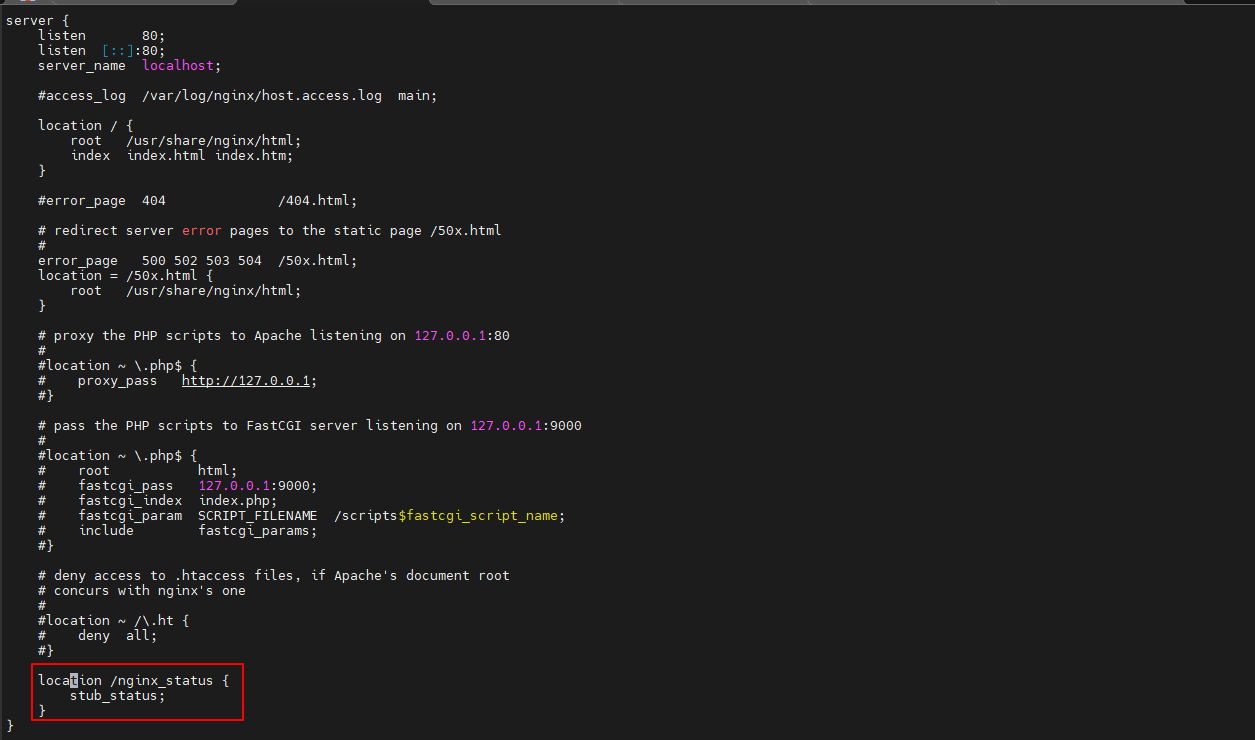
root@ng:/# vi /etc/nginx/conf.d/default.conf
在最后面的 } 上面添加如下内容(可以使用shift+insert进行粘贴)
    location /nginx_status {
        stub_status;
    }
在Pod里面重新加载
root@ng:/# nginx -s reload
4、在Pod里面测试是否生效
$ curl localhost/nginx_status

Active connections: 1
server accepts handled requests
 1 1 1
Reading: 0 Writing: 1 Waiting: 0
5、安装一个nginx的exporter
(1)helm下载包
$ helm repo add prometheus-community https://prometheus-community.github.io/helm-charts
$ helm repo update
$ helm pull prometheus-community/prometheus-nginx-exporter  --untar
(2)获取目标pod的ip为172.27.14.203
$ kubectl get po -o wide | grep ^ng

ng                                       1/1     Running   0                9h      172.27.14.203    k8s-node02     <none>           <none>
(3)编辑values.yaml
$ cd prometheus-nginx-exporter
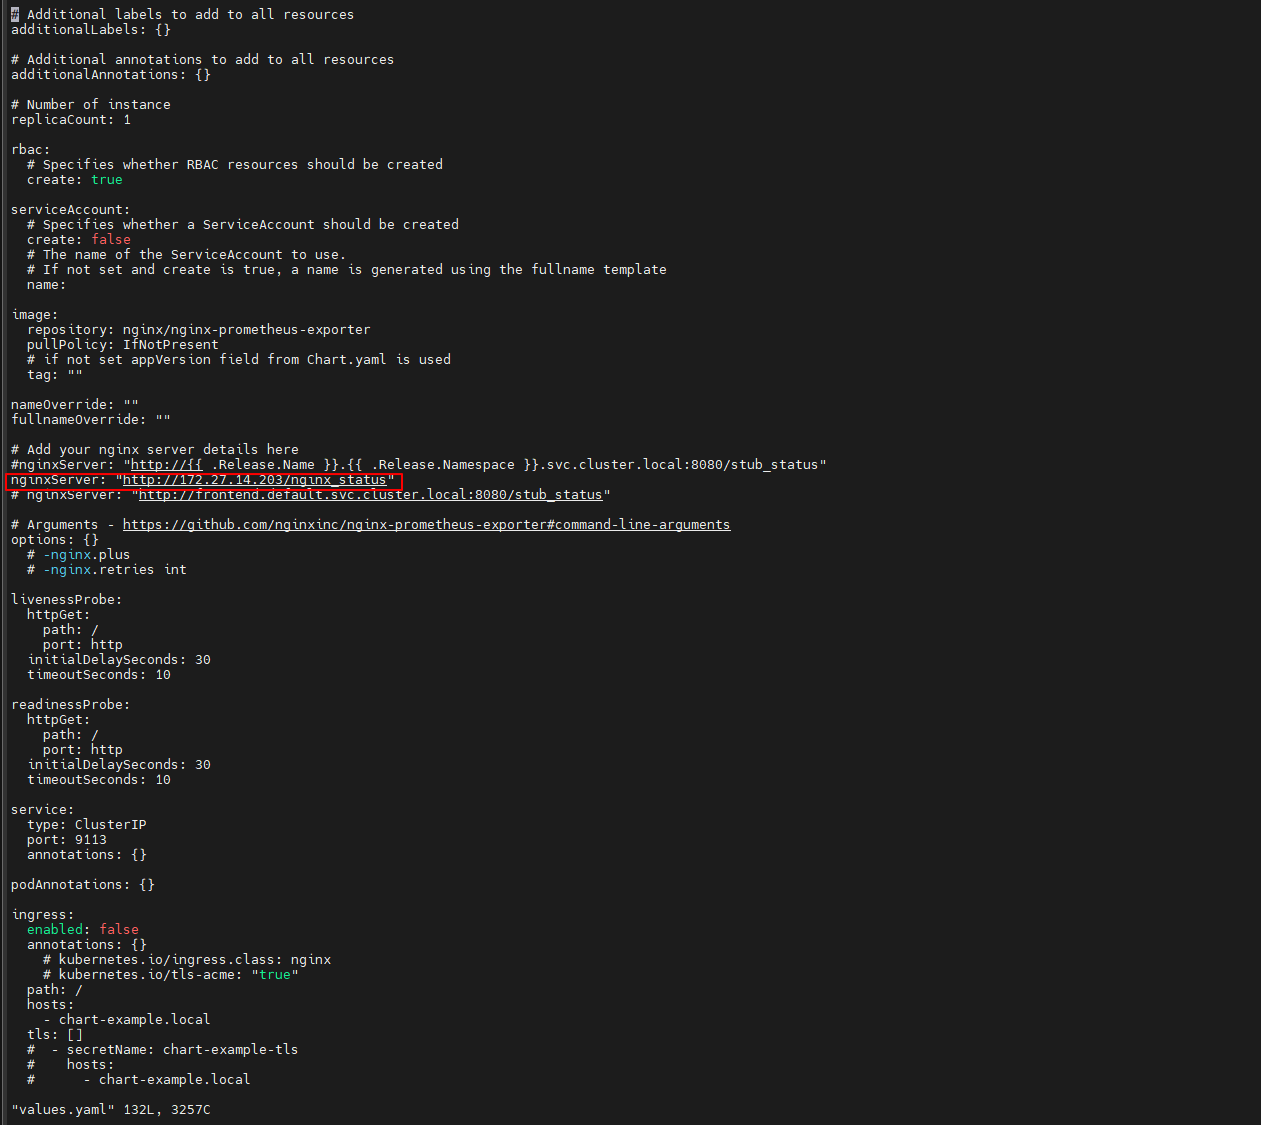
$ vi values.yaml
将 nginxServer: "http://{{ .Release.Name }}.{{ .Release.Namespace }}.svc.cluster.local:8080/stub_status" 这行注释,然后再增加一行nginxServer: "http://172.27.14.203/nginx_status"
(4)安装nginx-exporter
$ helm install prometheus-nginx-exporter .
(5)查看pod状态
$ kubectl get po | grep nginx-exporter

prometheus-nginx-exporter-5d7444f6df-s8xzg   1/1     Running   0              3m6s
(6)查看svc ip
$ kubectl get svc | grep nginx-exporter

prometheus-nginx-exporter    ClusterIP      10.0.31.168    <none>        9113/TCP                                                         3m37s
(7)访问
$ curl 10.0.31.168:9113/metrics

HELP nginx_connections_accepted Accepted client connections
TYPE nginx_connections_accepted counter
nginx_connections_accepted 3
HELP nginx_connections_active Active client connections
TYPE nginx_connections_active gauge
nginx_connections_active 1
HELP nginx_connections_handled Handled client connections
TYPE nginx_connections_handled counter
nginx_connections_handled 3
HELP nginx_connections_reading Connections where NGINX is reading the request header
TYPE nginx_connections_reading gauge
nginx_connections_reading 0
HELP nginx_connections_waiting Idle client connections
TYPE nginx_connections_waiting gauge
nginx_connections_waiting 0
HELP nginx_connections_writing Connections where NGINX is writing the response back to the client
TYPE nginx_connections_writing gauge
nginx_connections_writing 1
HELP nginx_http_requests_total Total http requests
TYPE nginx_http_requests_total counter
nginx_http_requests_total 3
HELP nginx_up Status of the last metric scrape
TYPE nginx_up gauge
nginx_up 1
HELP nginxexporter_build_info Exporter build information
TYPE nginxexporter_build_info gauge
nginxexporter_build_info{arch="linux/amd64",commit="e4a6810d4f0b776f7fde37fea1d84e4c7284b72a",date="2022-09-07T21:09:51Z",dirty="false",go="go1.19",version="0.11.0"} 1
6、将该metrics地址注册到consul里
(1)查看consul的service
$ kubectl get svc |grep consul

prometheus-consul-headless   ClusterIP      None           <none>        8500/TCP,8400/TCP,8301/TCP,8301/UDP,8300/TCP,8600/TCP,8600/UDP   2m9s
prometheus-consul-ui         ClusterIP      10.0.195.154   <none>        80/TCP                                                           2m9s
(2)注册
$ curl -X PUT -d '{"id": "test-ng","name": "test-nginx","address": "10.0.31.168","port": 9113,"tags": ["service"],"checks": [{"http": "http://10.0.31.168:9113/","interval": "5s"}]}' http://10.0.195.154/v1/agent/service/register
7、查看
(1)使用curl命令进行查看
$ curl 10.0.195.154/v1/catalog/service/test-nginx

[{"ID":"441285d8-c8d5-ab7a-d1fe-e2fab2b608f9","Node":"prometheus-consul-1","Address":"172.17.125.32","Datacenter":"dc1","TaggedAddresses":{"lan":"172.17.125.32","lan_ipv4":"172.17.125.32","wan":"172.17.125.32","wan_ipv4":"172.17.125.32"},"NodeMeta":{"consul-network-segment":"","consul-version":"1.16.2"},"ServiceKind":"","ServiceID":"test-ng","ServiceName":"test-nginx","ServiceTags":["service"],"ServiceAddress":"10.0.31.168","ServiceTaggedAddresses":{"lan_ipv4":{"Address":"10.0.31.168","Port":9113},"wan_ipv4":{"Address":"10.0.31.168","Port":9113}},"ServiceWeights":{"Passing":1,"Warning":1},"ServiceMeta":{},"ServicePort":9113,"ServiceSocketPath":"","ServiceEnableTagOverride":false,"ServiceProxy":{"Mode":"","MeshGateway":{},"Expose":{}},"ServiceConnect":{},"ServiceLocality":null,"CreateIndex":4651,"ModifyIndex":4651}
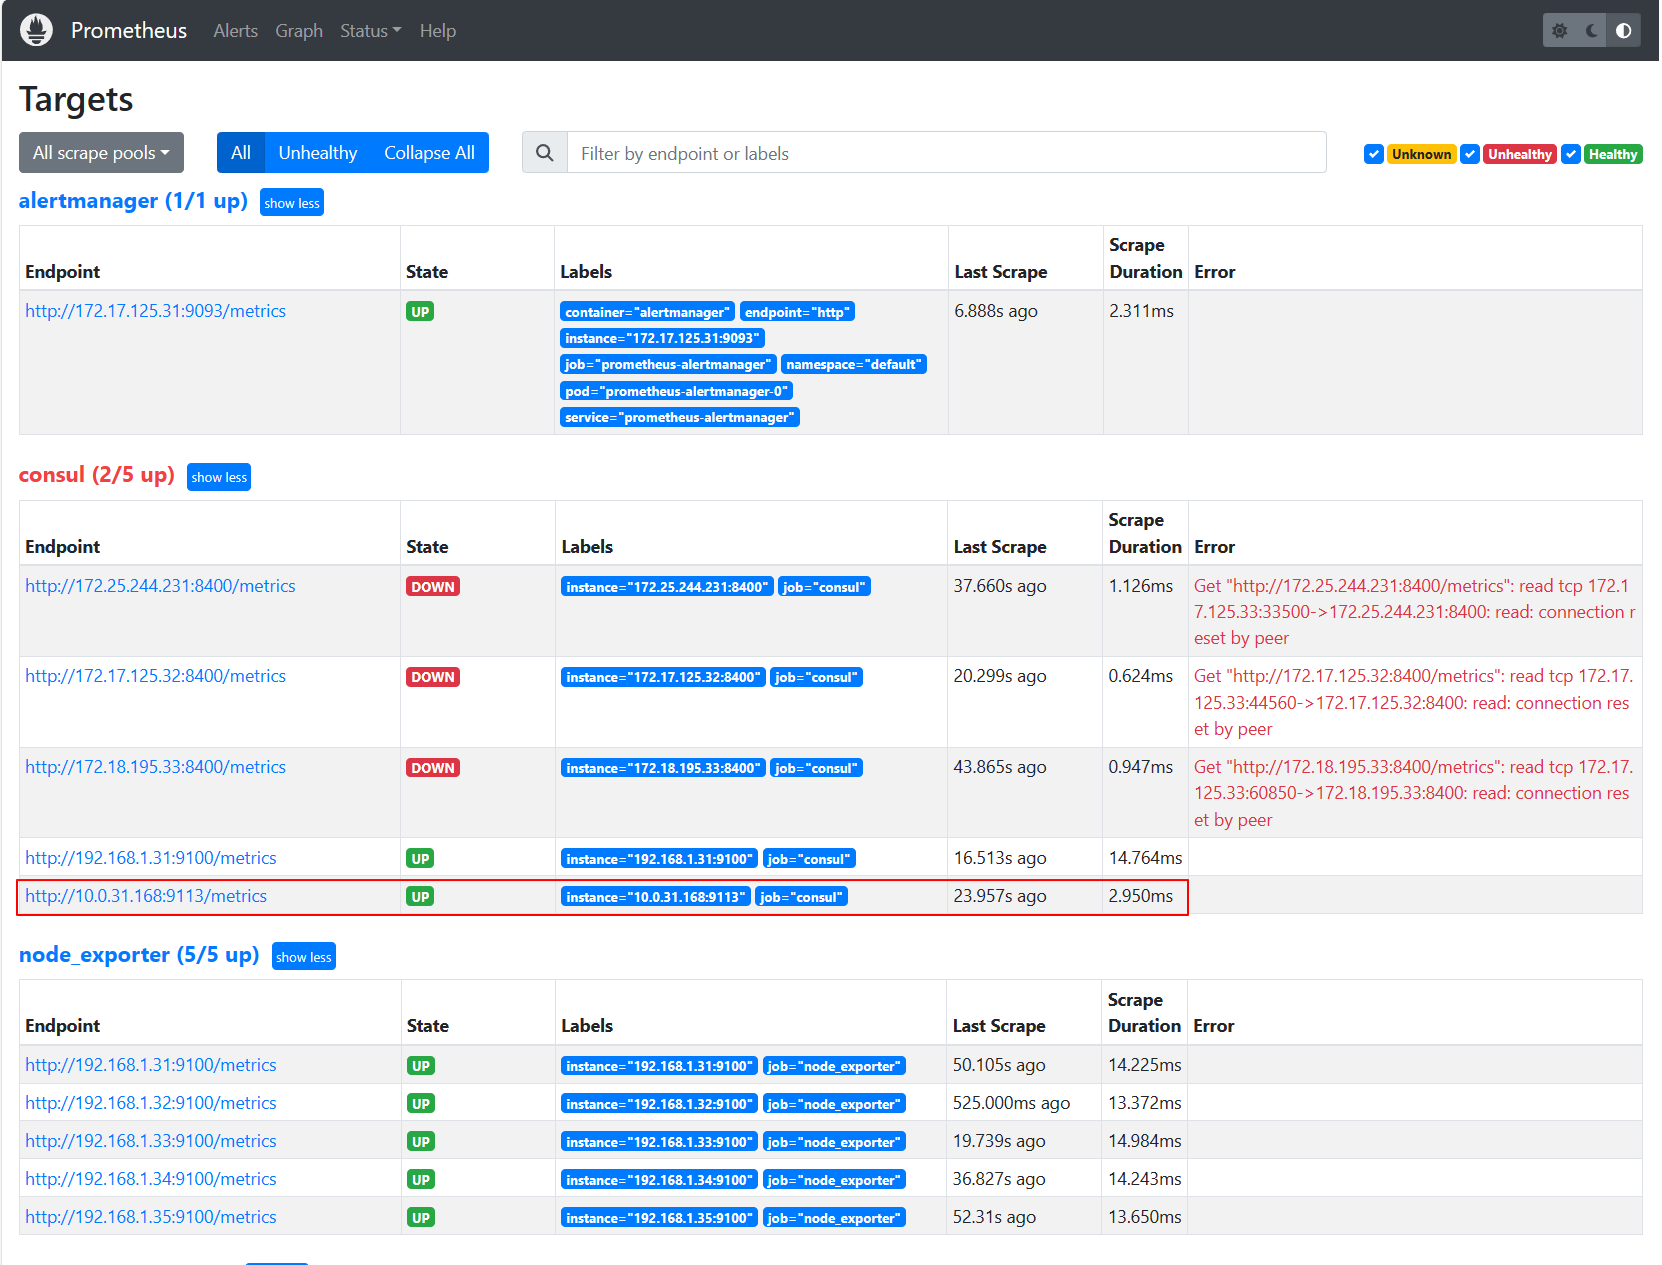
(2)打开浏览器输入http://192.168.1.31:31093访问Prometheus,到Prometheus页面下查看