

官方数据:https://argoproj.github.io/argo-rollouts/features/analysis/
一、主要 CRD 资源
1.1 渐进式部署(Rollout)
一个渐进式部署(Rollout)可以作为 Deployment 资源的一个直接替代品。它提供了额外的蓝绿 (blue-green)和金丝雀(canary)更新策略。这些策略可以在更新过程中创建分析运行 (AnalysisRuns)和验证,从而推进更新进程或者中止更新。
1.2 分析模板(AnalysisTemplate)
分析模板(AnalysisTemplate)是一个模板规范,定义了如何执行金丝雀分析,包括应该执行的度量指 标、其执行频率以及被认为是成功或失败的值。分析模板可以通过输入值进行参数化。
apiVersion: argoproj.io/v1alpha1

kind: AnalysisTemplate

metadata:

  name: success-rate

spec:

  args:

    # 模板参数,模板内部引用的格式为“{{args.NAME}}”;可在调用该模板时对其赋值;

    - name: <string>

      value: <string>

      valueFrom:

        secretKeyRef:

          name: <string>

          key: <string>

  metrics:

    # 必选字段,定义用于对交付效果进行分析的指标

    - name: <string>

      # 必选字段,指标名称;

      initialDelay: 5m

      # 延迟特定指标分析

      interval: 5m

      # 多次测试时的测试间隔时长

      consecutiveErrorLimit: <Object>

      count: <Object>

      # 总共测试的次数

      failureCondition: result[0] >= 0.95

      # 测试结果为“失败”的条件表达式

      # NOTE: prometheus queries return results in the form of a vector.

      # So it is common to access the index 0 of the returned array to obtain the value

      successCondition: result[0] >= 0.95

      # 测试结果为“成功”的条件表达式

      failureLimit: 3

      # 允许的最大失败运行次数

      provider:

        # 指标供应方,支持web、wavefront、skywalking、prometheus、plugin、newRelic、kayenta、job、influxdb、graphite、datadog、cloudWatch。

        prometheus:

          # Prometheus服务的访问入口

          address: http://prometheus.example.com:9090

          # 向Prometheus服务发起的查询请求(PromQL)

          query: |

            sum(irate(

              istio_requests_total{reporter="source",destination_service=~"{{args.service-name}}",response_code!~"5.*"}[5m]

            )) /

            sum(irate(

              istio_requests_total{reporter="source",destination_service=~"{{args.service-name}}"}[5m]

            ))

  # 运行于dryRun模式的metric列表,这些metric的结果不会影响最终分析结果

  dryRun:

    # 指标名称

    - metricName: <string>

    # 测量结果历史的保留数,dryRun模式的参数也支持历史结果保留

    measurementRetention:

    # 指标名称

    - metricName: <string>

      # 保留数量

      limit: <integer>
1.3 集群范围分析模板(ClusterAnalysisTemplate)
集群范围分析模板(ClusterAnalysisTemplate)类似于分析模板(AnalysisTemplate),但它的作用范围不限于特定的命名空间。它可以被集群中的任何渐进式部署(Rollout)所使用。
apiVersion: argoproj.io/v1alpha1

kind: ClusterAnalysisTemplate

metadata:

  name: success-rate

spec:

  args:

    # 模板参数,模板内部引用的格式为“{{args.NAME}}”;可在调用该模板时对其赋值;

    - name: <string>

      value: <string>

      valueFrom:

        secretKeyRef:

          name: <string>

          key: <string>

  metrics:

    # 必选字段,定义用于对交付效果进行分析的指标

    - name: <string>

      # 必选字段,指标名称;

      interval: 5m

      # 多次测试时的测试间隔时长

      # NOTE: prometheus queries return results in the form of a vector.

      # So it is common to access the index 0 of the returned array to obtain the value

      successCondition: result[0] >= 0.95

      # 测试结果为“成功”的条件表达式

      failureLimit: 3

      # 允许的最大失败运行次数

      provider:

        # 指标供应方,支持web、wavefront、skywalking、prometheus、plugin、newRelic、kayenta、job、influxdb、graphite、datadog、cloudWatch。

        prometheus:

          # Prometheus服务的访问入口

          address: http://prometheus.example.com:9090

          # 向Prometheus服务发起的查询请求(PromQL)

          query: |

            sum(irate(

              istio_requests_total{reporter="source",destination_service=~"{{args.service-name}}",response_code!~"5.*"}[5m]

            )) /

            sum(irate(

              istio_requests_total{reporter="source",destination_service=~"{{args.service-name}}"}[5m]

            ))

  dryRun:

    # 运行于dryRun模式的metric列表,这些metric的结果不会影响最终分析结果

    - metricName: <string>

      # 指标名称

  measurementRetention:

    # 测量结果历史的保留数,dryRun模式的参数也支持历史结果保留

    - metricName: <string>

      # 指标名称

      limit: <integer>

      # 保留数量
1.4 分析运行(AnalysisRun)
分析运行(AnalysisRun)是分析模板(AnalysisTemplate)的一次实例化。分析运行类似于 Job,在最 终会完成。完成的运行会被认为是成功、失败或不确定的结果,并且运行的结果会影响渐进式部署的更 新是否继续、中止或暂停。
apiVersion: argoproj.io/v1alpha1

kind: AnalysisRun

metadata:

  name: success-rate

spec:

  args:

    # 模板参数,模板内部引用的格式为“{{args.NAME}}”;可在调用该模板时对其赋值;

    - name: <string>

      value: <string>

      valueFrom:

        secretKeyRef:

          name: <string>

          key: <string>

  metrics:

    # 必选字段,定义用于对交付效果进行分析的指标

    - name: <string>

      # 必选字段,指标名称;

      interval: 5m

      # 多次测试时的测试间隔时长

      # NOTE: prometheus queries return results in the form of a vector.

      # So it is common to access the index 0 of the returned array to obtain the value

      successCondition: result[0] >= 0.95

      # 测试结果为“成功”的条件表达式

      failureLimit: 3

      # 允许的最大失败运行次数

      provider:

        # 指标供应方,支持web、wavefront、skywalking、prometheus、plugin、newRelic、kayenta、job、influxdb、graphite、datadog、cloudWatch。

        prometheus:

          # Prometheus服务的访问入口

          address: http://prometheus.example.com:9090

          # 向Prometheus服务发起的查询请求(PromQL)

          query: |

            sum(irate(

              istio_requests_total{reporter="source",destination_service=~"{{args.service-name}}",response_code!~"5.*"}[5m]

            )) /

            sum(irate(

              istio_requests_total{reporter="source",destination_service=~"{{args.service-name}}"}[5m]

            ))

  dryRun:

    # 运行于dryRun模式的metric列表,这些metric的结果不会影响最终分析结果

    - metricName: <string>

      # 指标名称

  measurementRetention:

    # 测量结果历史的保留数,dryRun模式的参数也支持历史结果保留

    - metricName: <string>

      # 指标名称

      limit: <integer>

      # 保留数量

  terminate: <boolean>
二、功能简介
Argo Rollouts 是一个用于 Kubernetes 上的渐进式交付工具,它提供了多种分析手段来驱动渐进式部署 过程。
这些分析手段可以帮助团队在部署新版本的应用程序时进行决策,确保新版本在生产环境中的稳定性和 可靠性。
Argo Rollout Analysis 支持多种分析模式:
-
Background Analysis:后台分析,canary 部署步骤执行时,可以在后台进行 AnalysisRun 分析, 以分析结果决定 canary rollout 的后续行为(推进/终止)。
-
Inline Analysis:内联分析,canary 部署步骤执行时,在到达某一阶段时启动 AnalysisRun,并在 运行完成之前阻止其推进,以分析结果决定 canary rollout 的后续行为(推进/终止)。
-
Analysis with Multiple Templates:多模板分析,在构建 AnalysisRun 时,Rollout 可以引用多个 AnalysisTemplate,允许从多个 AnalysisTemplate 进行分析。
-
Analysis Template Arguments:AnalysisTemplates 可以声明一组可以由 Rollouts 传递的参数。
-
BlueGreen Pre Promotion Analysis/BlueGreen Post Promotion Analysis:使用 BlueGreen 策略 的 Rollout 可以在流量切换到新版本前后启动 AnalysisRun进行分析,根据分析结果决定是否切换流量。
2.1 内联分析(Inline Analysis):阻塞
内联分析是指将分析作为部署步骤的一部分直接集成到工作流程中。当到达这个分析步骤时,会启动一 个 AnalysisRun,并且整个部署过程会暂停,直到分析运行完成为止。分析结果的成功或失败将决定是继续执行下一个部署步骤还是完全中止整个部署过程。
案例分析:
apiVersion: argoproj.io/v1alpha1

kind: Rollout

metadata:

  name: guestbook

spec:

...

  strategy:

    canary:

      steps:

        - setWeight: 20

        - pause:

            duration: 5m

        - analysis:

            templates:

              - templateName: success-rate

                args:

                  - name: service-name

                    value: guestbook-svc.default.svc.cluster.local
由于在这个例子中没有指定分析的时间间隔(interval),所以分析将只执行一次测量并完成。
apiVersion: argoproj.io/v1alpha1

kind: AnalysisTemplate

metadata:

  name: success-rate

spec:

  args:

    - name: service-name

    - name: prometheus-port

      value: 9090

  metrics:

    - name: success-rate

      successCondition: result[0] >= 0.95

      provider:

        prometheus:

          address: "http://prometheus.example.com:{{args.prometheus-port}}"

          query: |

            sum(irate(

              istio_requests_total{reporter="source",destination_service=~"{{args.service-name}}",response_code!~"5.*"}[5m]

            )) /

            sum(irate(

              istio_requests_total{reporter="source",destination_service=~"{{args.service-name}}"}[5m]

            ))
这是一个名为 success-rate 的分析模板(AnalysisTemplate),它定义了如何测量成功率。模板接受两个参数:
-
service-name :要分析的服务名称。
-
prometheus-port :Prometheus 监控服务器的端口,默认为 9090。
为了执行多次测量并在更长的时间范围内进行评估,可以指定 count 和 interval 字段:
metrics:

  - name: success-rate

    successCondition: result[0] >= 0.95

    interval: 60s

    count: 5

    provider:

      prometheus:

        address: http://prometheus.example.com:9090

        query: ...
2.2 后台分析(Background Analysis):非阻塞
后台分析允许在金丝雀部署过程中同时运行分析任务。这意味着即使是在逐步推广新版本的同时,也可以对应用的健康状况和其他关键指标进行监控和评估。
案例分析:
apiVersion: argoproj.io/v1alpha1

kind: Rollout

metadata:

  name: guestbook

spec:

  strategy:

    canary:

      analysis:

        templates:

          - templateName: success-rate

            startingStep: 2 # 延迟至 setWeight: 40% 时开始分析

            args:

              - name: service-name

                value: guestbook-svc.default.svc.cluster.local

      steps:

        - setWeight: 20

        - pause:

            duration: 10m

        - setWeight: 40

        - pause:

            duration: 10m

        - setWeight: 60

        - pause:

            duration: 10m

        - setWeight: 80

        - pause:

            duration: 10m
分析模板(AnalysisTemplate)配置:
apiVersion: argoproj.io/v1alpha1

kind: AnalysisTemplate

metadata:

  name: success-rate

spec:

  args:

    - name: service-name

  metrics:

    - name: success-rate

      interval: 5m

      successCondition: result[0] >= 0.95

      failureLimit: 3

      provider:

        prometheus:

          address: http://prometheus.example.com:9090

          query: |

            sum(irate(

              istio_requests_total{reporter="source",destination_service=~"{{args.service-name}}",response_code!~"5.*"}[5m]

            )) /

            sum(irate(

              istio_requests_total{reporter="source",destination_service=~"{{args.service-name}}"}[5m]

            ))
2.3 分析模板(Analysis Template)
分析模板是一个清单文件,它定义了用于判断新版本(通常称为 Green 或 Canary 版本)是否健康的标 准或度量指标。通过定义这些度量标准,团队可以设置自动化规则来判定新版本的表现,并据此做出是 否继续推广的决策。这有助于减少手动干预的需求,并且可以更加客观地评估应用程序的新版本在实际环境中的表现。
案例分析:
apiVersion: argoproj.io/v1alpha1

kind: AnalysisTemplate

metadata:

  name: service-success-rate

spec:

  args:

    - name: service-name

    - name: prometheus-port

      value: "9090"

  metrics:

    - name: success-rate

      interval: 5m

      count: 3

      successCondition: result[0] >= 0.95

      failureLimit: 2

      provider:

        prometheus:

          address: http://prometheus.example.com:{{args.prometheus-port}}

          query: |

            sum(irate(

              istio_requests_total{reporter="source",destination_service=~"{{args.service-name}}",response_code!~"5.*"}[5m]

            )) /

            sum(irate(

              istio_requests_total{reporter="source",destination_service=~"{{args.service-name}}"}[5m]

            ))
度量(Metrics):
-
name: success-rate 表示这个度量的名称。
-
interval: 5m 表示查询的时间间隔为 5 分钟。
-
count: 3 表示总共执行 3 次查询。
-
successCondition: result[0] >= 0.95 表示如果查询结果的第一个元素大于等于 0.95,则认为 度量成功。
-
failureLimit: 2 表示如果连续两次查询结果不满足 successCondition ,则认为分析失败。
-
provider: 数据来源配置。
-
address: Prometheus 服务器的地址,其中 {{args.prometheus-port}} 是一个模板参 数,表示Prometheus 服务器的端口号。
-
query: Prometheus 查询表达式,用于计算服务的成功率。
整体结论:
模板会在指定的时间间隔内(例如每 5 分钟)执行 3 次查询,以检查服务的成功率。如果在连续两次查询中成功率低于 95%,则分析失败。
三、智能渐进式交付
3.1 创建 Rollout 对象
[root@master01 ~]# cd /root/17/argo-rollouts/argorollout-examples

[root@master01 argorollout-examples]# mkdir canary-analysis

[root@master01 argorollout-examples]# cd canary-analysis/

[root@master01 canary-analysis]# cat <<EOF >> rollout-with-analysis.yaml

apiVersion: argoproj.io/v1alpha1

kind: Rollout

metadata:

  name: canary-rollouts-analysis-demo

  namespace: demo

spec:

  replicas: 3

  strategy:

    canary:

      analysis:

        templates:

        - templateName: success-rate  # 使用的 AnalysisTemplates

        startingStep: 2  # step 的索引,从第2个step开始分析(40%),第1个是20%初始的时候

        args:  # 传入AnalysisTemplates的参数

        - name: ingress

          value: rollouts-analysis-stable-ing

      canaryService: rollouts-analysis-canary

      stableService: rollouts-analysis-stable

      trafficRouting:

        nginx:

          stableIngress: rollouts-analysis-stable-ing

      # 发布的节奏

      steps:

      - setWeight: 20

      - pause: {}         # 需要手动确认通过

      - setWeight: 40

      - pause: {duration: 60s}

      - setWeight: 60

      - pause: {duration: 60s}

      - setWeight: 80

      - pause: {duration: 60s}

  revisionHistoryLimit: 2

  selector:

    matchLabels:

      app: rollouts-analysis-demo

  template:

    metadata:

      labels:

        app: rollouts-analysis-demo

    spec:

      containers:

      - name: rollouts-analysis-demo

        image: registry.cn-hangzhou.aliyuncs.com/zhdya/kubernetes-bootcamp:v1

        ports:

        - name: http

          containerPort: 8080

          protocol: TCP

EOF
analysis:定义了在金丝雀部署过程中要执行的分析模板和参数。这个例子中使用了名为 success-rate 的模板,并在第2步开始应用分析。 args 部分传递了参数 ingress ,其值为 canary-demo 。
3.2 创建应用的 stable/canary SVC
[root@master01 ~]# cd /root/17/argo-rollouts/argorollout-examples/canary-analysis

[root@master01 canary-analysis]# cat <<EOF >> rollouts-analysis-svc.yaml

apiVersion: v1

kind: Service

metadata:

  name: rollouts-analysis-canary

  namespace: demo

spec:

  ports:

  - port: 8080

    targetPort: http

    protocol: TCP

    name: http

  selector:

    app: rollouts-analysis-demo

---

apiVersion: v1

kind: Service

metadata:

  name: rollouts-analysis-stable

  namespace: demo

spec:

  ports:

  - port: 8080

    targetPort: http

    protocol: TCP

    name: http

  selector:

    app: rollouts-analysis-demo

EOF
3.3 创建应用的 ingress 路由
[root@master01 ~]# cd /root/17/argo-rollouts/argorollout-examples/canary-analysis

[root@master01 canary-analysis]# cat <<EOF >> canary-analysis-ing.yaml

apiVersion: networking.k8s.io/v1

kind: Ingress

metadata:

  name: rollouts-analysis-stable-ing

  namespace: demo

spec:

  ingressClassName: nginx

  rules:

  - host: canary-analysis.example.com

    http:

      paths:

      - backend:

          service:

            name: rollouts-analysis-stable

            port:

              number: 8080

        path: /

        pathType: Prefix

EOF
3.4 创建自动分析 AnalysisTemplate 模板
[root@master01 ~]# cd /root/17/argo-rollouts/argorollout-examples/canary-analysis

[root@master01 canary-analysis]# cat <<EOF >> analysis-success.yaml

apiVersion: argoproj.io/v1alpha1

kind: AnalysisTemplate

metadata:

  name: success-rate

  namespace: demo

spec:

  args:

  - name: ingress

  metrics:

  - name: success-rate

    initialDelay: 1s  #延迟 60s 后启动

    interval: 2s  #查询指标的频率

    failureLimit: 2  #3 次不满足 successCondition 则视为失败

    successCondition: result[0] > 0.90  #成功条件:测量值为空(指标还没采集到)或者大于 90%

    provider:

      prometheus:

        address: http://prometheus.monitor.svc:9090  #Prometheus 地址

        query: >+  #查询语句

          sum(

            rate(nginx_ingress_controller_requests{ingress="{{args.ingress}}",status!~"[4-5].*"}[60s]))

            /

            sum(rate(nginx_ingress_controller_requests{ingress="{{args.ingress}}"}[60s])

          )

EOF
以下是关于这个配置文件的详细解释:
-
metadata:部分中的name设置了AnalysisTemplate的名称为success-rate。
-
spec:部分定义了模板的具体参数和度量指标。
-
args:定义了模板需要的输入参数。在这个例子中,只有一个参数ingress。
-
metrics:定义了度量指标的集合。在这个例子中,只有一个度量指标success-rate。
-
interval:度量指标的采集间隔,此例中设置为10秒。
-
failureLimit:在分析过程中允许的失败次数,此例中设置为3次。
-
successCondition:成功条件,此例中设置为result[0] > 0.90,表示只有当成功率大于90%时,应 用程序才被认为是成功的。
-
provider:定义了度量指标数据来源。此例中使用Prometheus作为度量指标的提供者。
-
address:Prometheus实例的地址。
-
query:Prometheus查询表达式,用于计算应用程序的成功率。这个查询计算了过去60秒内 非4xx和5xx状态码的请求占总请求的比例。
3.5 创建APP
[root@master01 ~]# cd /root/17/argo-rollouts/argorollout-examples/

[root@master01 argorollout-examples]# cat <<EOF >> argorollout-canary-analysis.yaml

apiVersion: argoproj.io/v1alpha1

kind: Application

metadata:

  name: argorollout-analysis-traffic

  namespace: argocd

spec:

  destination:

    name: ''

    namespace: default

    server: 'https://kubernetes.default.svc'

  source:

    path: canary-analysis

    repoURL: 'http://gitlab.example.com/demoteam/argocd-example-apps.git'

    targetRevision: main

  sources: []

  project: default

EOF
把上述几个文件放入代码仓库 http://gitlab.example.com/demoteam/argocd-example-apps.git
[root@master01 ~]# cd /root/17/argo-rollouts/argorollout-examples

[root@master01 argorollout-examples]# git init

# 添加远端仓库

[root@master01 argorollout-examples]# git remote add origin http://gitlab.example.com/demoteam/argocd-example-apps.git

# 验证查看

[root@master01 argorollout-examples]# git remote -v

origin  http://gitlab.example.com/demoteam/argocd-example-apps.git (fetch)

origin  http://gitlab.example.com/demoteam/argocd-example-apps.git (push)

# 添加到暂存区

[root@master01 argorollout-examples]# git add .

# 提交到本地仓库

[root@master01 argorollout-examples]# git commit -m "third for argocd-example-apps"

# 切换到main分支

[root@master01 argorollout-examples]# git branch -M main

# 上传到main分支

[root@master01 argorollout-examples]# git push -uf origin main

Username for 'http://gitlab.example.com': root

Password for 'http://root@gitlab.example.com': <gitlab-password>
应用创建
[root@master01 ~]# cd /root/17/argo-rollouts/argorollout-examples

[root@master01 argorollout-examples]# kubectl apply -f argorollout-canary-analysis.yaml
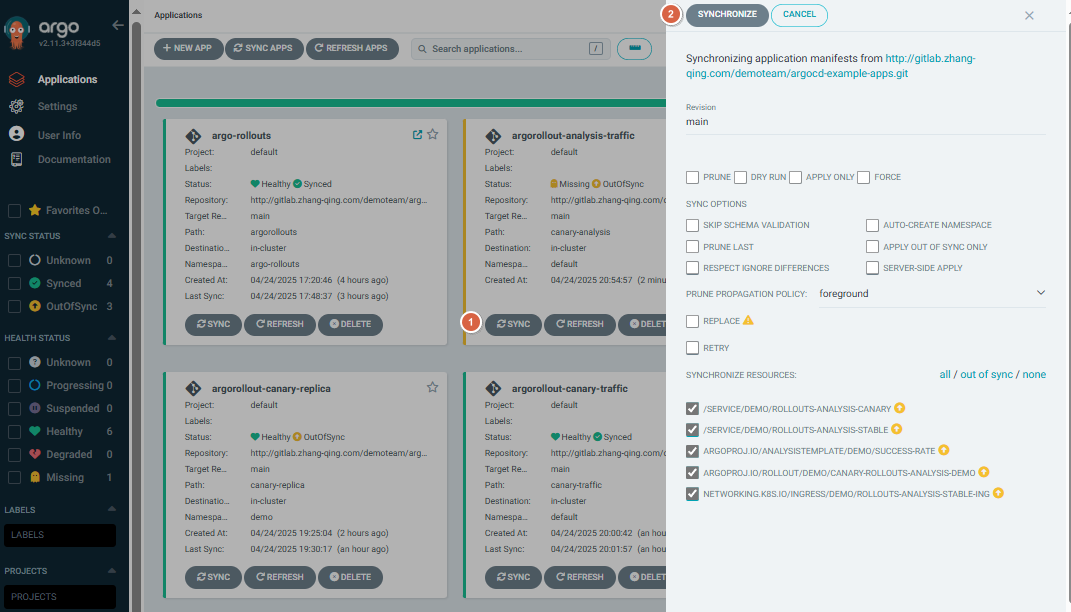
浏览器输入https://argocd.example.com/打开argocd页面,点击【SYNC】-【SYNCHRPNIZE】进行手动同步
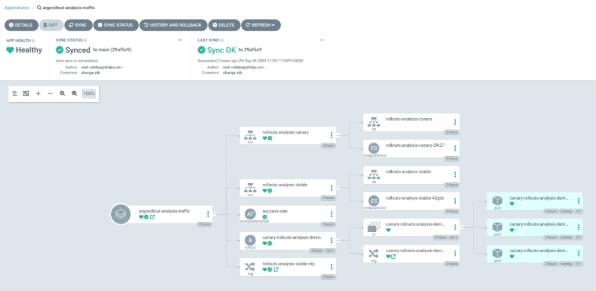
查看树形图
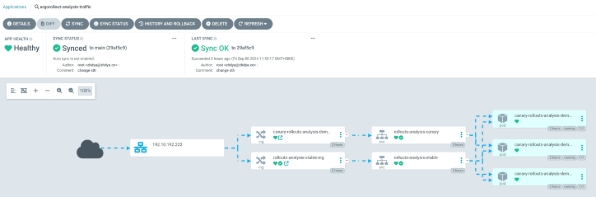
查看网络走向
四、配置 ingress-nginx 的 metrics
4.1 开启 metrics 端口
第一种办法:
开启 metrics 端口:
[root@master01 ~]# kubectl patch deployment ingress-nginx-controller -n ingress-nginx --

type='json' -p='[{"op": "add", "path": "/spec/template/spec/containers/0/ports/-

", "value": {"name": "prometheus","containerPort":10254}}]'
开启 metrics 数据采集:
[root@master01 ~]# kubectl patch service ingress-nginx-controller -n ingress-nginx --type='json' -

p='[{"op": "add", "path": "/spec/ports/-", "value": {"name":

"prometheus","port":10254,"targetPort":"prometheus"}}]'
第二种,基于 helm 方式安装:
修改 values.yaml 文件:
[root@master01 ~]# cd /root/6/ingress-nginx

[root@master01 ingress-nginx]# vim values.yaml

# 修改第655行内容

655     enabled: true

metrics:

  port: 10254

  portName: metrics

  # if this port is changed, change healthz-port: in extraArgs: accordingly

  enabled: true

  service:

    annotations: {}

    # prometheus.io/scrape: "true"

    # prometheus.io/port: "10254"

    # -- Labels to be added to the metrics service resource

    labels: {}

...

# 完整配置文件

[root@master01 ingress-nginx]# egrep -v "#|^$" values.yaml

commonLabels: {}

controller:

  name: controller

  image:

    chroot: false

    registry: registry.cn-hangzhou.aliyuncs.com

    image: google_containers/nginx-ingress-controller

    tag: "v1.7.0"

    digestChroot: sha256:e84ef3b44c8efeefd8b0aa08770a886bfea1f04c53b61b4ba9a7204e9f1a7edc

    pullPolicy: IfNotPresent

    runAsUser: 101

    allowPrivilegeEscalation: true

  existingPsp: ""

  containerName: controller

  containerPort:

    http: 80

    https: 443

  config:

    load-balance: "round_robin"

  configAnnotations: {}

  proxySetHeaders: {}

  addHeaders: {}

  dnsConfig: {}

  hostname: {}

  dnsPolicy: ClusterFirstWithHostNet

  reportNodeInternalIp: false

  watchIngressWithoutClass: false

  ingressClassByName: false

  enableTopologyAwareRouting: false

  allowSnippetAnnotations: true

  hostNetwork: true

  hostPort:

    enabled: false

    ports:

      http: 80

      https: 443

  electionID: ""

  ingressClassResource:

    name: nginx

    enabled: true

    default: false

    controllerValue: "k8s.io/ingress-nginx"

    parameters: {}

  ingressClass: nginx

  podLabels: {}

  podSecurityContext: {}

  sysctls: {}

  publishService:

    enabled: true

    pathOverride: ""

  scope:

    enabled: false

    namespace: ""

    namespaceSelector: ""

  configMapNamespace: ""

  tcp:

    configMapNamespace: ""

    annotations: {}

  udp:

    configMapNamespace: ""

    annotations: {}

  maxmindLicenseKey: ""

  extraArgs: {}

  extraEnvs: []

  kind: DaemonSet

  annotations: {}

  labels: {}

  updateStrategy: {}

  minReadySeconds: 0

  tolerations: []

  affinity: {}

  topologySpreadConstraints: []

  terminationGracePeriodSeconds: 300

  nodeSelector:

    kubernetes.io/os: linux

    ingress: "true"

  livenessProbe:

    httpGet:

      path: "/healthz"

      port: 10254

      scheme: HTTP

    initialDelaySeconds: 10

    periodSeconds: 10

    timeoutSeconds: 1

    successThreshold: 1

    failureThreshold: 5

  readinessProbe:

    httpGet:

      path: "/healthz"

      port: 10254

      scheme: HTTP

    initialDelaySeconds: 10

    periodSeconds: 10

    timeoutSeconds: 1

    successThreshold: 1

    failureThreshold: 3

  healthCheckPath: "/healthz"

  healthCheckHost: ""

  podAnnotations: {}

  replicaCount: 1

  minAvailable: 1

  resources:

    requests:

      cpu: 100m

      memory: 90Mi

  autoscaling:

    apiVersion: autoscaling/v2

    enabled: false

    annotations: {}

    minReplicas: 1

    maxReplicas: 11

    targetCPUUtilizationPercentage: 50

    targetMemoryUtilizationPercentage: 50

    behavior: {}

  autoscalingTemplate: []

  keda:

    apiVersion: "keda.sh/v1alpha1"

    enabled: false

    minReplicas: 1

    maxReplicas: 11

    pollingInterval: 30

    cooldownPeriod: 300

    restoreToOriginalReplicaCount: false

    scaledObject:

      annotations: {}

    triggers: []

    behavior: {}

  enableMimalloc: true

  customTemplate:

    configMapName: ""

    configMapKey: ""

  service:

    enabled: true

    appProtocol: true

    annotations: {}

    labels: {}

    externalIPs: []

    loadBalancerIP: ""

    loadBalancerSourceRanges: []

    enableHttp: true

    enableHttps: true

    ipFamilyPolicy: "SingleStack"

    ipFamilies:

      - IPv4

    ports:

      http: 80

      https: 443

    targetPorts:

      http: http

      https: https

    type: LoadBalancer

    nodePorts:

      http: ""

      https: ""

      tcp: {}

      udp: {}

    external:

      enabled: true

    internal:

      enabled: false

      annotations: {}

      loadBalancerSourceRanges: []

  shareProcessNamespace: false

  extraContainers: []

  extraVolumeMounts: []

  extraVolumes: []

  extraInitContainers:

  - name: sysctl

    image: registry.cn-hangzhou.aliyuncs.com/abroad_images/alpine:3.10

    imagePullPolicy: IfNotPresent

    command:

      - sh

      - -c

      - |

        mount -o remount rw /proc/sys

        sysctl -w net.core.somaxconn=65535

        sysctl -w net.ipv4.tcp_tw_reuse=1

        sysctl -w net.ipv4.ip_local_port_range="1024 65535"

        sysctl -w fs.file-max=1048576

        sysctl -w fs.inotify.max_user_instances=16384

        sysctl -w fs.inotify.max_user_watches=524288

        sysctl -w fs.inotify.max_queued_events=16384

    securityContext:

      privileged: true

  extraModules: []

  opentelemetry:

    enabled: false

    image: registry.k8s.io/ingress-nginx/opentelemetry:v20230312-helm-chart-4.5.2-28-g66a760794@sha256:40f766ac4a9832f36f217bb0e98d44c8d38faeccbfe861fbc1a76af7e9ab257f

    containerSecurityContext:

      allowPrivilegeEscalation: false

  admissionWebhooks:

    annotations: {}

    enabled: true

    extraEnvs: []

    failurePolicy: Fail

    port: 8443

    certificate: "/usr/local/certificates/cert"

    key: "/usr/local/certificates/key"

    namespaceSelector: {}

    objectSelector: {}

    labels: {}

    existingPsp: ""

    networkPolicyEnabled: false

    service:

      annotations: {}

      externalIPs: []

      loadBalancerSourceRanges: []

      servicePort: 443

      type: ClusterIP

    createSecretJob:

      securityContext:

        allowPrivilegeEscalation: false

      resources: {}

    patchWebhookJob:

      securityContext:

        allowPrivilegeEscalation: false

      resources: {}

    patch:

      enabled: true

      image:

        registry: registry.cn-hangzhou.aliyuncs.com

        image: google_containers/kube-webhook-certgen

        tag: v20230312-helm-chart-4.5.2-28-g66a760794

        pullPolicy: IfNotPresent

      priorityClassName: ""

      podAnnotations: {}

      nodeSelector:

        kubernetes.io/os: linux

      tolerations: []

      labels: {}

      securityContext:

        runAsNonRoot: true

        runAsUser: 2000

        fsGroup: 2000

    certManager:

      enabled: false

      rootCert:

        duration: ""

      admissionCert:

        duration: ""

  metrics:

    port: 10254

    portName: metrics

    enabled: true

    service:

      annotations:

        prometheus.io/scrape: "true"

        prometheus.io/port: "10254"

      labels: {}

      externalIPs: []

      loadBalancerSourceRanges: []

      servicePort: 10254

      type: ClusterIP

    serviceMonitor:

      enabled: false

      additionalLabels: {}

      namespace: ""

      namespaceSelector: {}

      scrapeInterval: 30s

      targetLabels: []

      relabelings: []

      metricRelabelings: []

    prometheusRule:

      enabled: true

      additionalLabels: {}

      namespace: "monitoring"

      rules:

        - alert: NginxFailedReload

          expr: nginx_ingress_controller_config_last_reload_successful == 0

          for: 1m

          labels:

            severity: critical

          annotations:

            summary: "Nginx配置重载失败"

            description: "Nginx Ingress Controller配置重载失败,实例: {{ $labels.instance }}"

        - alert: HighHttp4xxRate

          expr: |

            sum(rate(nginx_ingress_controller_requests{status=~"4.."}[5m])) by (host, namespace)

            /

            sum(rate(nginx_ingress_controller_requests[5m])) by (host, namespace)

          for: 5m

          labels:

            severity: warning

          annotations:

            summary: "HTTP 4xx错误率过高 ({{ $value }}%)"

            description: "命名空间 {{ $labels.namespace }} 主机 {{ $labels.host }}"

        - alert: HighHttp5xxRate

          expr: |

            sum(rate(nginx_ingress_controller_requests{status=~"5.."}[5m])) by (host, namespace)

            /

            sum(rate(nginx_ingress_controller_requests[5m])) by (host, namespace)

            * 100 > 1

          for: 2m

          labels:

            severity: critical

          annotations:

            summary: "HTTP 5xx错误率过高 ({{ $value }}%)"

            description: "命名空间 {{ $labels.namespace }} 主机 {{ $labels.host }}"

        - alert: HighLatency

          expr: |

            histogram_quantile(0.99,

              sum by (le, host, namespace) (

                rate(nginx_ingress_controller_request_duration_seconds_bucket[2m])

              )

          for: 5m

          labels:

            severity: warning

          annotations:

            summary: "高延迟请求 (p99: {{ $value }}秒)"

            description: "命名空间 {{ $labels.namespace }} 主机 {{ $labels.host }}"

        - alert: HighRequestRate

          expr: |

          for: 5m

          labels:

            severity: warning

          annotations:

            summary: "高请求速率 ({{ $value }} req/s)"

            description: "实例 {{ $labels.instance }}"

        - alert: SSLCertExpiring15d

          expr: |

          for: 1h

          labels:

            severity: warning

          annotations:

            summary: "SSL证书即将过期 ({{ $labels.host }})"

            description: "证书 {{ $labels.secret_name }} 将在15天内过期 (剩余: {{ $value | humanizeDuration }})"

        - alert: SSLCertExpiring7d

          expr: |

          for: 1h

          labels:

            severity: critical

          annotations:

            summary: "SSL证书即将过期 ({{ $labels.host }})"

            description: "证书 {{ $labels.secret_name }} 将在7天内过期 (剩余: {{ $value | humanizeDuration }})"

  lifecycle:

    preStop:

      exec:

        command:

          - /wait-shutdown

  priorityClassName: ""

revisionHistoryLimit: 10

defaultBackend:

  enabled: false

  name: defaultbackend

  image:

    registry: registry.k8s.io

    image: defaultbackend-amd64

    tag: "1.5"

    pullPolicy: IfNotPresent

    runAsUser: 65534

    runAsNonRoot: true

    readOnlyRootFilesystem: true

    allowPrivilegeEscalation: false

  existingPsp: ""

  extraArgs: {}

  serviceAccount:

    create: true

    name: ""

    automountServiceAccountToken: true

  extraEnvs: []

  port: 8080

  livenessProbe:

    failureThreshold: 3

    initialDelaySeconds: 30

    periodSeconds: 10

    successThreshold: 1

    timeoutSeconds: 5

  readinessProbe:

    failureThreshold: 6

    initialDelaySeconds: 0

    periodSeconds: 5

    successThreshold: 1

    timeoutSeconds: 5

  updateStrategy: {}

  minReadySeconds: 0

  tolerations: []

  affinity: {}

  podSecurityContext: {}

  containerSecurityContext: {}

  podLabels: {}

  nodeSelector:

    kubernetes.io/os: linux

  podAnnotations: {}

  replicaCount: 1

  minAvailable: 1

  resources: {}

  extraVolumeMounts: []

  extraVolumes: []

  autoscaling:

    apiVersion: autoscaling/v2

    annotations: {}

    enabled: false

    minReplicas: 1

    maxReplicas: 2

    targetCPUUtilizationPercentage: 50

    targetMemoryUtilizationPercentage: 50

  service:

    annotations: {}

    externalIPs: []

    loadBalancerSourceRanges: []

    servicePort: 80

    type: ClusterIP

  priorityClassName: ""

  labels: {}

rbac:

  create: true

  scope: false

podSecurityPolicy:

  enabled: false

serviceAccount:

  create: true

  name: ""

  automountServiceAccountToken: true

  annotations: {}

imagePullSecrets: []

tcp: {}

udp: {}

portNamePrefix: ""

dhParam: ""
更新 ingress-nginx 服务:
[root@master01 ~]# helm upgrade ingress-nginx ./ingress-nginx -f ./ingress-nginx/values.yaml -n ingress-nginx
验证
# 查看pod

[root@master01 ingress-nginx]# kgp -ningress-nginx

NAME                             READY   STATUS    RESTARTS       AGE

ingress-nginx-controller-8lnp9   1/1     Running   11 (10h ago)   11d

ingress-nginx-controller-wx2hd   1/1     Running   11 (10h ago)   11d

# 查看svc,暴露了10254端口

[root@master01 ingress-nginx]# kgs -ningress-nginx | grep metrics

ingress-nginx-controller-metrics     ClusterIP      <cluster-ip>    <none>        10254/TCP                    11d

# 查看监控到的指标信息

[root@master01 ~]# curl <cluster-ip>:10254/metrics

...

...

promhttp_metric_handler_requests_total{code="200"} 7377

promhttp_metric_handler_requests_total{code="500"} 0

promhttp_metric_handler_requests_total{code="503"} 0
4.2 配置数据采集
Prometheus 能够抓取到 Ingress-Nginx 指标:
1)单体 yaml 文件:
[root@master01 ~]# cd /root/7

[root@master01 7]# vim prometheus-config.yaml

# 新增下面配置

    ########## Ingress 监控配置 ##########

    - job_name: 'ingress-nginx-endpoints'

      kubernetes_sd_configs:

      - role: pod

        namespaces:

          names:

          - ingress-nginx

      relabel_configs:

      - source_labels: [__meta_kubernetes_pod_container_port_number]

        action: keep

        regex: "10254"

# 完整配置文件

[root@master01 7]# cat  prometheus-config.yaml

apiVersion: v1

kind: ConfigMap

metadata:

  name: prometheus-config

  namespace: monitor

data:

  prometheus.yml: |

    global:

      scrape_interval:     15s

      evaluation_interval: 15s

      external_labels:

        cluster: "kubernetes"

    ############ 添加配置 Aertmanager 服务器地址 ###################

    alerting:

      alertmanagers:

      - static_configs:

        - targets: ["alertmanager:9093"]

    ############ 数据采集job ###################

    scrape_configs:

    ########## Ingress 监控配置 ##########

    - job_name: 'ingress-nginx-endpoints'

      kubernetes_sd_configs:

      - role: pod

        namespaces:

          names:

          - ingress-nginx

      relabel_configs:

      - source_labels: [__meta_kubernetes_pod_container_port_number]

        action: keep

        regex: "10254"

    ########## Argocd 监控配置 ##########

    - job_name: 'argocd-metrics'

      static_configs:

        - targets: ['argocd-metrics.argocd.svc.cluster.local:8082']

    - job_name: 'argocd-server-metrics'

      static_configs:

        - targets: ['argocd-server-metrics.argocd.svc.cluster.local:8083']

    - job_name: 'argocd-repo-server-metrics'

      static_configs:

        - targets: ['argocd-repo-server.argocd.svc.cluster.local:8084']

    ########## prometheus 监控配置 ##########

    - job_name: prometheus

      static_configs:

      - targets: ['127.0.0.1:9090']

        labels:

          instance: prometheus

    ########## apisix 监控配置 ##########

    - job_name: "apisix"

      scrape_interval: 15s

      metrics_path: "/apisix/prometheus/metrics"

      static_configs:

      - targets: [metrics.example.com]

    ########## minio 监控配置 ##########

    - job_name: minio-job

      bearer_token: <prometheus-bearer-token>

      metrics_path: /minio/v2/metrics/cluster

      scheme: http

      static_configs:

        - targets: [s3.example.com]

    ########## kube-apiserver 监控配置 ##########

    - job_name: kube-apiserver

      kubernetes_sd_configs:

      - role: endpoints

      scheme: https

      tls_config:

        ca_file: /var/run/secrets/kubernetes.io/serviceaccount/ca.crt

      bearer_token_file: /var/run/secrets/kubernetes.io/serviceaccount/token

      relabel_configs:

      - source_labels: [__meta_kubernetes_namespace, __meta_kubernetes_service_name]

        action: keep

        regex: default;kubernetes

      - source_labels: [__meta_kubernetes_endpoints_name]

        action: replace

        target_label: endpoint

      - source_labels: [__meta_kubernetes_pod_name]

        action: replace

        target_label: pod

      - source_labels: [__meta_kubernetes_service_name]

        action: replace

        target_label: service

      - source_labels: [__meta_kubernetes_namespace]

        action: replace

        target_label: namespace

    ########## kube-controller-manager 监控配置 ##########

    - job_name: 'kube-controller-manager'

      # 使用 Kubernetes Pod 发现机制

      kubernetes_sd_configs:

        - role: pod

      # 强制使用 HTTPS 协议

      scheme: https

      # TLS 配置(测试环境跳过验证)

      tls_config:

        insecure_skip_verify: true

      # 使用 ServiceAccount 的 Token 认证

      bearer_token_file: /var/run/secrets/kubernetes.io/serviceaccount/token

      relabel_configs:

        # 保留标签为 component=kube-controller-manager 的 Pod

        - source_labels: [__meta_kubernetes_pod_label_component]

          regex: kube-controller-manager

          action: keep

        # 重写目标地址为 Pod IP + 10257 端口

        - source_labels: [__meta_kubernetes_pod_ip]

          regex: (.+)

          target_label: __address__

          replacement: "${1}:10257"

        # 强制使用 HTTPS 协议(冗余但明确)

        - source_labels: []

          regex: .*

          target_label: __scheme__

          replacement: https

        # 附加元数据标签

        - source_labels: [__meta_kubernetes_endpoints_name]

          action: replace

          target_label: endpoint

        - source_labels: [__meta_kubernetes_pod_name]

          action: replace

          target_label: pod

        - source_labels: [__meta_kubernetes_service_name]

          action: replace

          target_label: service

        - source_labels: [__meta_kubernetes_namespace]

          action: replace

          target_label: namespace

    ########## kube-scheduler 监控配置 ##########

    - job_name: 'kube-scheduler'

      kubernetes_sd_configs:

        - role: pod

      scheme: https

      tls_config:

        insecure_skip_verify: true

      bearer_token_file: /var/run/secrets/kubernetes.io/serviceaccount/token

      relabel_configs:

        - source_labels: [__meta_kubernetes_pod_label_component]

          regex: kube-scheduler

          action: keep

        - source_labels: [__meta_kubernetes_pod_ip]

          regex: (.+)

          target_label: __address__

          replacement: "${1}:10259"

        - source_labels: []

          regex: .*

          target_label: __scheme__

          replacement: https

        - source_labels: [__meta_kubernetes_endpoints_name]

          action: replace

          target_label: endpoint

        - source_labels: [__meta_kubernetes_pod_name]

          action: replace

          target_label: pod

        - source_labels: [__meta_kubernetes_service_name]

          action: replace

          target_label: service

        - source_labels: [__meta_kubernetes_namespace]

          action: replace

          target_label: namespace

    ########## kube-state-metrics 监控配置 ##########

    - job_name: kube-state-metrics

      kubernetes_sd_configs:

      - role: endpoints

      relabel_configs:

      - source_labels: [__meta_kubernetes_service_name]

        regex: kube-state-metrics

        action: keep

      - source_labels: [__meta_kubernetes_pod_ip]

        regex: (.+)

        target_label: __address__

        replacement: ${1}:8080

      - source_labels: [__meta_kubernetes_endpoints_name]

        action: replace

        target_label: endpoint

      - source_labels: [__meta_kubernetes_pod_name]

        action: replace

        target_label: pod

      - source_labels: [__meta_kubernetes_service_name]

        action: replace

        target_label: service

      - source_labels: [__meta_kubernetes_namespace]

        action: replace

        target_label: namespace

    ########## coredns 监控配置 ##########

    - job_name: coredns

      kubernetes_sd_configs:

      - role: endpoints

      relabel_configs:

      - source_labels:

          - __meta_kubernetes_service_label_k8s_app

        regex: kube-dns

        action: keep

      - source_labels: [__meta_kubernetes_pod_ip]

        regex: (.+)

        target_label: __address__

        replacement: ${1}:9153

      - source_labels: [__meta_kubernetes_endpoints_name]

        action: replace

        target_label: endpoint

      - source_labels: [__meta_kubernetes_pod_name]

        action: replace

        target_label: pod

      - source_labels: [__meta_kubernetes_service_name]

        action: replace

        target_label: service

      - source_labels: [__meta_kubernetes_namespace]

        action: replace

        target_label: namespace

    ########## etcd 监控配置 ##########

    - job_name: etcd

      kubernetes_sd_configs:

      - role: pod

      relabel_configs:

      - source_labels:

          - __meta_kubernetes_pod_label_component

        regex: etcd

        action: keep

      - source_labels: [__meta_kubernetes_pod_ip]

        regex: (.+)

        target_label: __address__

        replacement: ${1}:2381

      - source_labels: [__meta_kubernetes_endpoints_name]

        action: replace

        target_label: endpoint

      - source_labels: [__meta_kubernetes_pod_name]

        action: replace

        target_label: pod

      - source_labels: [__meta_kubernetes_namespace]

        action: replace

        target_label: namespace

    ########## kubelet 监控配置 ##########

    - job_name: kubelet

      metrics_path: /metrics/cadvisor

      scheme: https

      tls_config:

        insecure_skip_verify: true

      bearer_token_file: /var/run/secrets/kubernetes.io/serviceaccount/token

      kubernetes_sd_configs:

      - role: node

      relabel_configs:

      - action: labelmap

        regex: __meta_kubernetes_node_label_(.+)

      - source_labels: [__meta_kubernetes_endpoints_name]

        action: replace

        target_label: endpoint

      - source_labels: [__meta_kubernetes_pod_name]

        action: replace

        target_label: pod

      - source_labels: [__meta_kubernetes_namespace]

        action: replace

        target_label: namespace

    ########## k8s-node 监控配置 ##########

    - job_name: k8s-nodes

      kubernetes_sd_configs:

      - role: node

      relabel_configs:

      - source_labels: [__address__]

        regex: '(.*):10250'

        replacement: '${1}:9100'

        target_label: __address__

        action: replace

      - action: labelmap

        regex: __meta_kubernetes_node_label_(.+)

      - source_labels: [__meta_kubernetes_endpoints_name]

        action: replace

        target_label: endpoint

      - source_labels: [__meta_kubernetes_pod_name]

        action: replace

        target_label: pod

      - source_labels: [__meta_kubernetes_namespace]

        action: replace

        target_label: namespace

    ########## DNS 监控配置 ##########

    - job_name: "kubernetes-dns"

      metrics_path: /probe              # 不是metrics,是probe

      params:

        module: [dns_tcp]               # 使用DNS TCP模块

      static_configs:

        - targets:

          - kube-dns.kube-system:53             #不要省略端口号

          - 8.8.4.4:53

          - 8.8.8.8:53

          - 223.5.5.5:53

      relabel_configs:

        - source_labels: [__address__]

          target_label: __param_target

        - source_labels: [__param_target]

          target_label: instance

        - target_label: __address__

          replacement: blackbox-exporter.monitor:9115 # 服务地址,和上面的 Service 定义保持一致

    ########## ICMP 监控配置 ##########

    - job_name: icmp-status

      metrics_path: /probe

      params:

        module: [icmp]

      static_configs:

      - targets:

        - <node-ip>

        labels:

          group: icmp

      relabel_configs:

      - source_labels: [__address__]

        target_label: __param_target

      - source_labels: [__param_target]

        target_label: instance

      - target_label: __address__

        replacement: blackbox-exporter.monitor:9115

    ########## HTTP 监控配置 ##########

    - job_name: 'kubernetes-services'

      metrics_path: /probe

      params:

        module:         ## 使用HTTP_GET_2xx与HTTP_GET_3XX模块

        - "http_get_2xx"

        - "http_get_3xx"

      kubernetes_sd_configs:            ## 使用Kubernetes动态服务发现,且使用Service类型的发现

      - role: service

      relabel_configs:          ## 设置只监测Kubernetes Service中Annotation里配置了注解prometheus.io/http_probe: true的service

      - action: keep

        source_labels: [__meta_kubernetes_service_annotation_prometheus_io_http_probe]

        regex: "true"

      - action: replace

        source_labels:

        - "__meta_kubernetes_service_name"

        - "__meta_kubernetes_namespace"

        - "__meta_kubernetes_service_annotation_prometheus_io_http_probe_port"

        - "__meta_kubernetes_service_annotation_prometheus_io_http_probe_path"

        target_label: __param_target

        regex: (.+);(.+);(.+);(.+)

        replacement: $1.$2:$3$4

      - target_label: __address__

        replacement: blackbox-exporter.monitor:9115             ## BlackBox Exporter 的 Service 地址

      - source_labels: [__param_target]

        target_label: instance

      - action: labelmap

        regex: __meta_kubernetes_service_label_(.+)

      - source_labels: [__meta_kubernetes_namespace]

        target_label: kubernetes_namespace

      - source_labels: [__meta_kubernetes_service_name]

        target_label: kubernetes_name

    ########## TCP 监控配置 ##########

    - job_name: "service-tcp-probe"

      scrape_interval: 1m

      metrics_path: /probe

      # 使用blackbox exporter配置文件的tcp_connect的探针

      params:

        module: [tcp_connect]

      kubernetes_sd_configs:

      - role: service

      relabel_configs:

      # 保留prometheus.io/scrape: "true"和prometheus.io/tcp-probe: "true"的service

      - source_labels: [__meta_kubernetes_service_annotation_prometheus_io_scrape, __meta_kubernetes_service_annotation_prometheus_io_tcp_probe]

        action: keep

        regex: true;true

      # 将原标签名__meta_kubernetes_service_name改成service_name

      - source_labels: [__meta_kubernetes_service_name]

        action: replace

        regex: (.*)

        target_label: service_name

      # 将原标签名__meta_kubernetes_service_name改成service_name

      - source_labels: [__meta_kubernetes_namespace]

        action: replace

        regex: (.*)

        target_label: namespace

      # 将instance改成 `clusterIP:port` 地址

      - source_labels: [__meta_kubernetes_service_cluster_ip, __meta_kubernetes_service_annotation_prometheus_io_http_probe_port]

        action: replace

        regex: (.*);(.*)

        target_label: __param_target

        replacement: $1:$2

      - source_labels: [__param_target]

        target_label: instance

      # 将__address__的值改成 `blackbox-exporter.monitor:9115`

      - target_label: __address__

        replacement: blackbox-exporter.monitor:9115

    ########## Ingress 监控配置 ##########

    - job_name: 'blackbox-k8s-ingresses'

      scrape_interval: 30s

      scrape_timeout: 10s

      metrics_path: /probe

      params:

        module: [http_get_2xx]  # 使用定义的http模块

      kubernetes_sd_configs:

      - role: ingress  # ingress 类型的服务发现

      relabel_configs:

      # 只有ingress的annotation中配置了 prometheus.io/http_probe=true 的才进行发现

      - source_labels: [__meta_kubernetes_ingress_annotation_prometheus_io_http_probe]

        action: keep

        regex: true

      - source_labels: [__meta_kubernetes_ingress_scheme,__address__,__meta_kubernetes_ingress_path]

        regex: (.+);(.+);(.+)

        replacement: ${1}://${2}${3}

        target_label: __param_target

      - target_label: __address__

        replacement: blackbox-exporter.monitor:9115

      - source_labels: [__param_target]

        target_label: instance

      - action: labelmap

        regex: __meta_kubernetes_ingress_label_(.+)

      - source_labels: [__meta_kubernetes_namespace]

        target_label: kubernetes_namespace

      - source_labels: [__meta_kubernetes_ingress_name]

        target_label: kubernetes_name

    ########## 外部域名 监控配置 ##########

    - job_name: "blackbox-external-website"

      scrape_interval: 30s

      scrape_timeout: 15s

      metrics_path: /probe

      params:

        module: [http_get_2xx]

      static_configs:

      - targets:

        - https://www.baidu.com # 改为公司对外服务的域名

        - https://www.jd.com

      relabel_configs:

      - source_labels: [__address__]

        target_label: __param_target

      - source_labels: [__param_target]

        target_label: instance

      - target_label: __address__

        replacement: blackbox-exporter.monitor:9115

    ########## 云上ECS 监控配置 ##########

    - job_name: 'other-ECS'

      static_configs:

        - targets: ['101.201.68.158:9100']

          labels:

            hostname: 'test-node-exporter'

    ########## 进程 监控配置 ##########

    - job_name: 'process-exporter'

      static_configs:

      - targets: ['<node-ip>:9256']

    ########## Mysql 监控配置 ##########

    - job_name: 'mysql-exporter'

      static_configs:

      - targets: ['<node-ip>:9104']

    ########## Consul 监控配置 ##########

    - job_name: consul

      honor_labels: true

      metrics_path: /metrics

      scheme: http

      consul_sd_configs:    #基于consul服务发现的配置

        - server: <node-ip>:18500    #consul的监听地址

          services: []                 #匹配consul中所有的service

      relabel_configs:             #relabel_configs下面都是重写标签相关配置

      - source_labels: ['__meta_consul_tags']    #将__meta_consul_tags标签的至赋值给product

        target_label: 'servername'

      - source_labels: ['__meta_consul_dc']   #将__meta_consul_dc的值赋值给idc

        target_label: 'idc'

      - source_labels: ['__meta_consul_service']

        regex: "consul"  #匹配为"consul"的service

        action: drop       #执行的动作为删除

    ############ 指定告警规则文件路径位置 ###################

    rule_files:

    - /etc/prometheus/rules/*.rules
热加载 prometheus
[root@master01 7]# curl -XPOST http://prometheus.example.com/-/reload
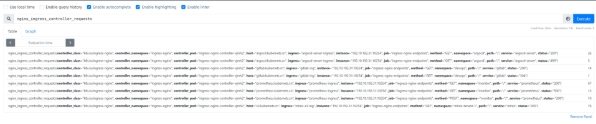
点击【Targets】在 prometheus target 验证:

点击【Graph】输入下面内容进行数据指标验证:
nginx_ingress_controller_requests
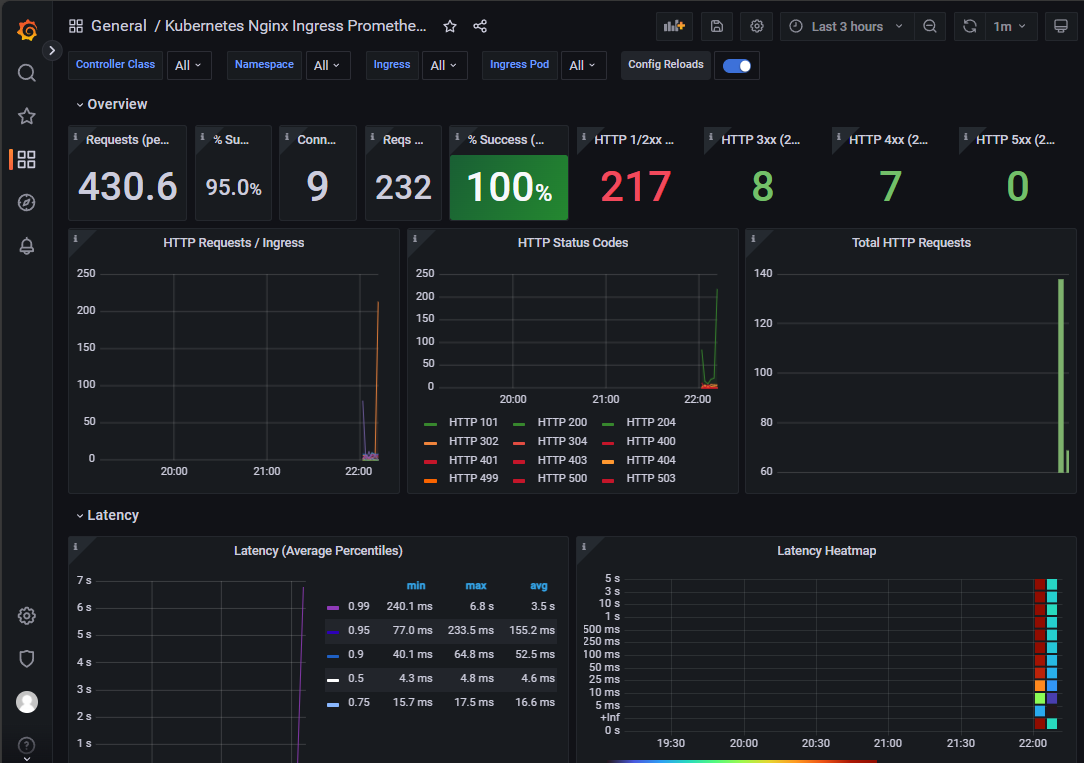
打开grafana,导入模板9614
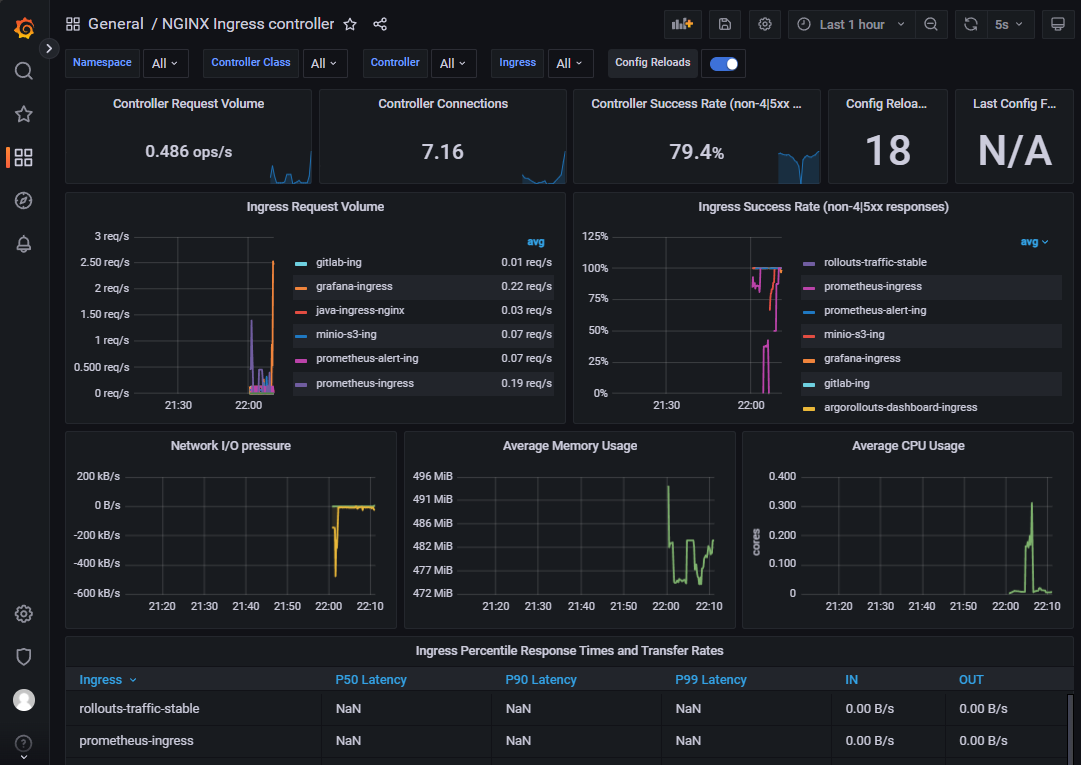
打开grafana,导入模板14314
2)prometheus-operator 数据采集:
apiVersion: monitoring.coreos.com/v1

kind: ServiceMonitor

metadata:

  name: nginx-ingress-controller-metrics

  namespace: monitor

  labels:

    app: nginx-ingress

    release: prometheus-operator

spec:

  endpoints:

    - interval: 10s

      port: prometheus

  selector:

    matchLabels:

      app.kubernetes.io/instance: ingress-nginx

      app.kubernetes.io/name: ingress-nginx

  namespaceSelector:

    matchNames:

      - ingress-nginx
4.3 指标数据验证
填入已知数据,随机访问已知 ingress 域名,验证测试 prometheus 数据:
# 计算成功率(百分比格式)

(

  sum by (ingress) (

    rate(nginx_ingress_controller_requests{

      ingress="argocd-server-ingress",

      status!~"^[45]\\d{2}$"  # 精确匹配 4xx/5xx 状态码

    }[60s])

  )

/

  sum by (ingress) (

    rate(nginx_ingress_controller_requests{

      ingress="argocd-server-ingress"

    }[60s])

  )

) * 100

五、实战验证
5.1 智能渐进式交付成功案例
提前测试访问
[root@master01 ~]# for i in {1..5000}; do curl canary-analysis.example.com; done
通过 kubectl 插件来更新镜像:
[root@master01 ~]# kubectl argo rollouts set image canary-rollouts-analysis-demo rollouts-analysis-demo=registry.cn-hangzhou.aliyuncs.com/zhdya/kubernetes-bootcamp:v2 -ndemo
动态观察:
[root@master01 ~]# kubectl argo rollouts get rollout canary-rollouts-analysis-demo -ndemo --watch
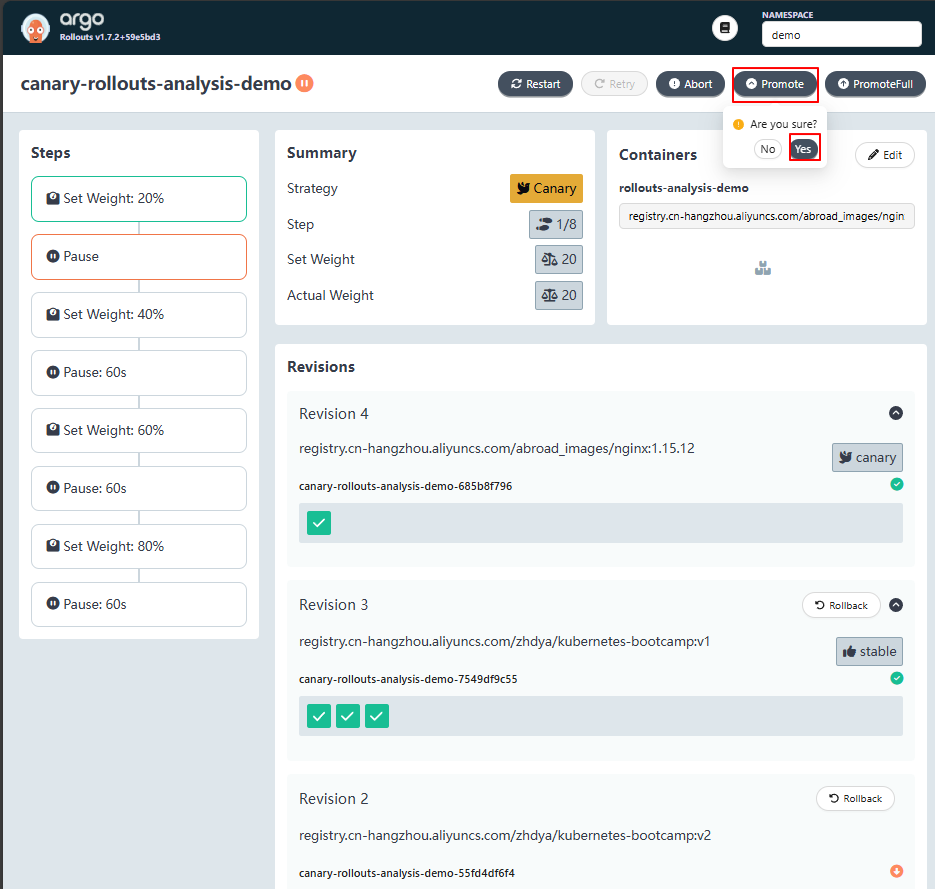
进入控制台,观察自动渐进式交付过程。可以看到目前处在 20% 金丝雀流量的下一阶段,也就是暂停的阶段。
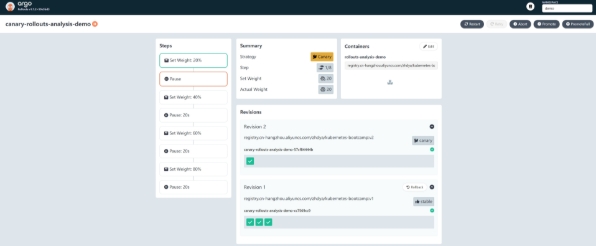
promote 后,将进入到 40% 金丝雀流量阶段:
[root@master01 ~]# kubectl argo rollouts promote canary-rollouts-analysis-demo -ndemo
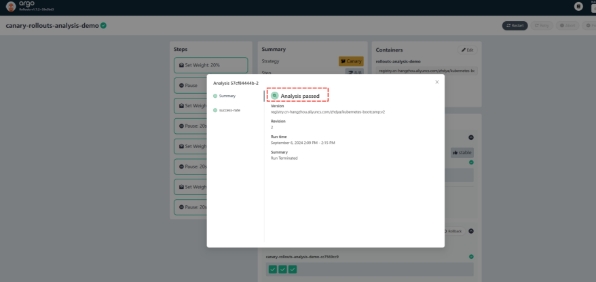
从这个阶段开始,自动金丝雀分析开始工作,直到最后金丝雀发布完成,金丝雀环境提升为了生产环境,这时自动分析也完成了,如下图所示
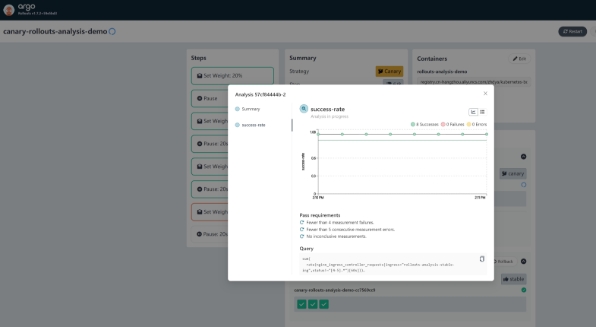
到这里,一次完整的自动渐进式交付就完成了:
5.2 智能渐进式交付失败案例(注意!在模式失败的时候,按照视频来增加极端数据的调整)
在上面的实验中,由于应用返回的 HTTP 状态码都是 200 ,所以金丝雀分析自然是会成功的。 接下来,来尝试进行自动渐进式交付失败的实验。
提前制造失败访问
[root@master01 ~]#  for i in {1..66666}; do curl canary-analysis.example.com/-/aaaa; done

# 返回的结果都是200

...

...

Hello Kubernetes bootcamp! | Running on: canary-rollouts-analysis-demo-7549df9c55-tsjm8 | v=1

Hello Kubernetes bootcamp! | Running on: canary-rollouts-analysis-demo-7549df9c55-z4pfm | v=1

Hello Kubernetes bootcamp! | Running on: canary-rollouts-analysis-demo-7549df9c55-z4pfm | v=1

Hello Kubernetes bootcamp! | Running on: canary-rollouts-analysis-demo-7549df9c55-tsjm8 | v=1
通过 kubectl 插件来更新镜像:
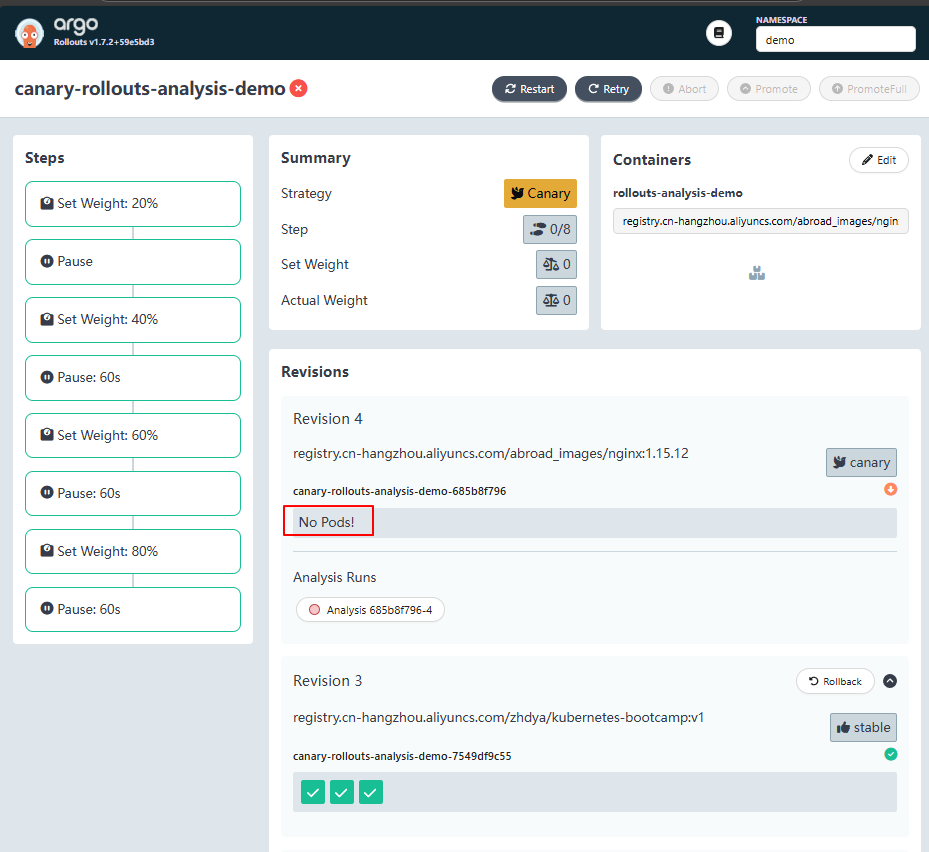
[root@master01 ~]# kubectl argo rollouts set image canary-rollouts-analysis-demo rollouts-analysis-demo=registry.cn-hangzhou.aliyuncs.com/abroad_images/nginx:1.15.12 -ndemo
动态观察:
[root@master01 ~]# kubectl argo rollouts get rollout canary-rollouts-analysis-demo -ndemo --watch
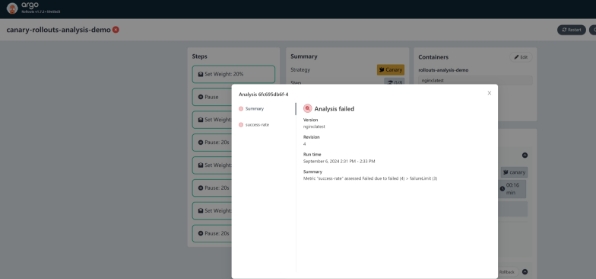
点击【Promote】
等待一段时间后,金丝雀分析将失败,如下图所示:
此时,Argo Rollout 将执行自动回滚操作,删除新起来的pod:
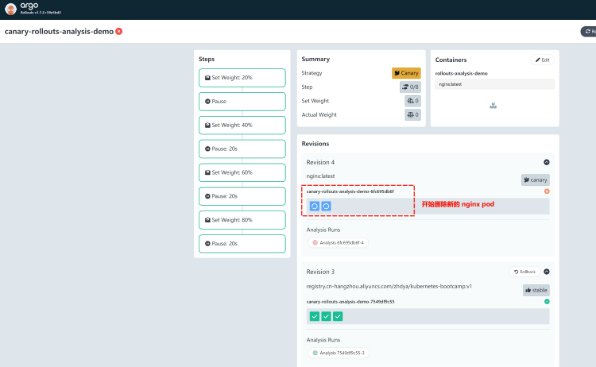
到这里,一次完整的渐进式交付失败实验就成功了:
六、总结
通过 Argo Rollouts Analysis,实现智能的渐进式交付,确保新版本在生产环境中逐步推广时能够得到充 分的监控和评估。
这种方式可以显著提高部署的安全性和可靠性,减少因新版本引入问题而导致的服务中断风险。
通过灵活配置分析模板和渐进式部署策略,可以根据不同的业务需求和环境特性来定制最适合的部署流程。