
一、Prometheus -Redis-exporter 监控 多实例监控部署
官网地址 https://grafana.com/oss/prometheus/exporters/redis-exporter/?tab=installation
介绍
1、grafana官方出品 ,promethus-redis指标采集 +grafana面板
下载地址
wget https://github.com/oliver006/redis_exporter/releases/download/v1.50.0/redis_exporter-v1.50.0.linux-amd64.tar.gz
tar zxvf redis_exporter-v1.50.0.linux-amd64.tar.gz
mv redis_exporter-v1.50.0.linux-amd64 redis_exporter
cd redis_exporter
./redis_exporter --help
-namespace string #指标名字
-redis.addr string #redis地址 ,多实例监控参数
-redis.password string #redis密码监控
-redis.user string #6.0版本 ACL特性
-web.listen-address string #默认端口 9121
-web.telemetry-path string #指标暴露地址 ,默认 /redis-metrics,即 http://192.168.9.78:9090/metrics
多实例配置 redis-exporter 监控步骤
1、安装 promethus+grafana(略)
2、启动 exporter
nohup ./redis_exporter -redis.addr= -web.listen-address:9121 & #观察指标
curl http://192.168.9.78:9121/metrics
3、配置文件 ,prometheus.yml中加入 job
cat prometheus.yml
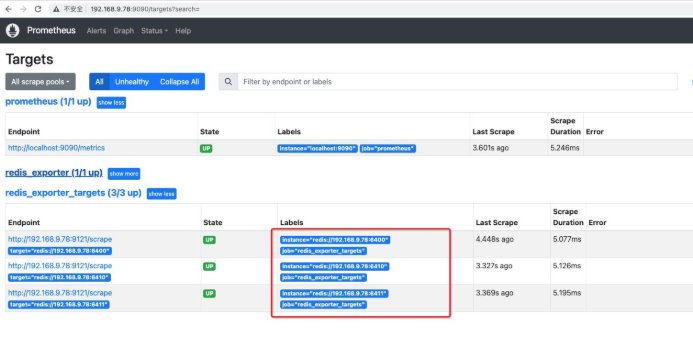
- job_name: 'redis_exporter_targets'
static_configs:
- targets:
- redis://192.168.9.78:6400
- redis://192.168.9.78:6410
- redis://192.168.9.78:6411
metrics_path: /scrape
relabel_configs:
- source_labels: [__address__]
target_label: __param_target
- source_labels: [__param_target]
target_label: instance
- target_label: __address__
replacement: 192.168.9.78:9121
- job_name: 'redis_exporter'
static_configs:
- targets:
- 192.168.9.78:9121
热加载 prometheus
curl -X POST 192.168.9.78:9090/-/reload
查看指标
http://192.168.9.78:9090/targets
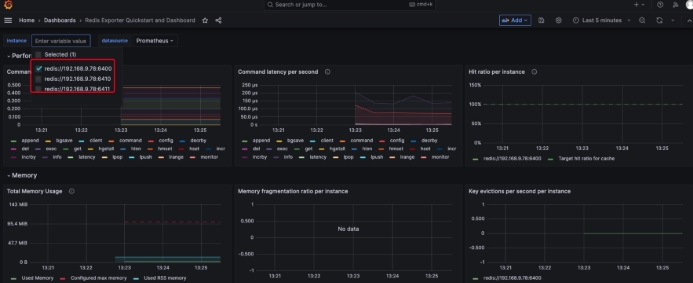
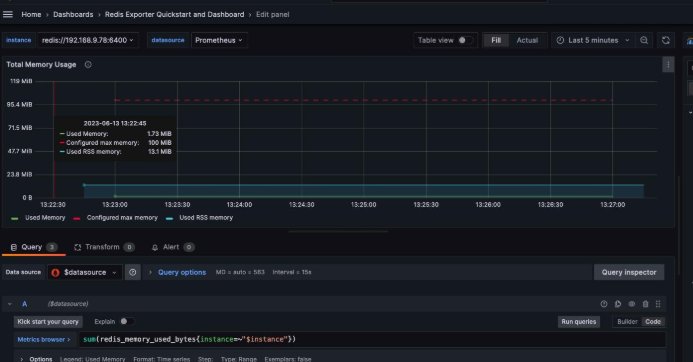
4、配置 dashboard, 导入 Dashboard
地址: https://grafana.com/oss/prometheus/exporters/redis-exporter/?tab=dashboards 在 grafana中导入 json模板
增加与更改指标
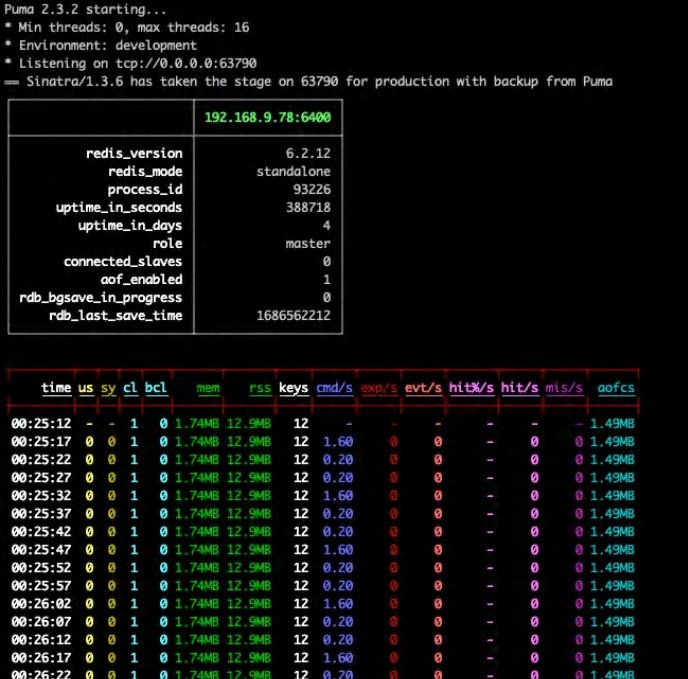
二、redis-stat (作业)
轻量级 redis服务监控运行 ,基于 INFO信息 ,比 monitor(影响性能 )要友好 分为终端命令行和可视化 web界面两种
最佳场景 :压测,实时监控
使用步骤
网址: https://github.com/junegunn/redis-stat/
# 安装ruby
sudo yum install ruby
sudo yum install ruby-devel
# gem update --system -- 更新到最新版
# 移除默认镜像地址并更换国内镜像地址
gem sources --remove https://rubygems.org -a https://gems.ruby-china.com
# 更换国内镜像地址 可选镜像
gem sources -a https://gems.ruby-china.com
gem sources --add https://mirrors.tuna.tsinghua.edu.cn/rubygems/
# 查看
gem sources –l
# gem安装
gem install redis-stat
# 源码方式
wget https://github.com/junegunn/redis-stat/releases
# 黑屏命令行监控
./redis-stat 192.168.9.78:6400 192.168.9.78:6411 5
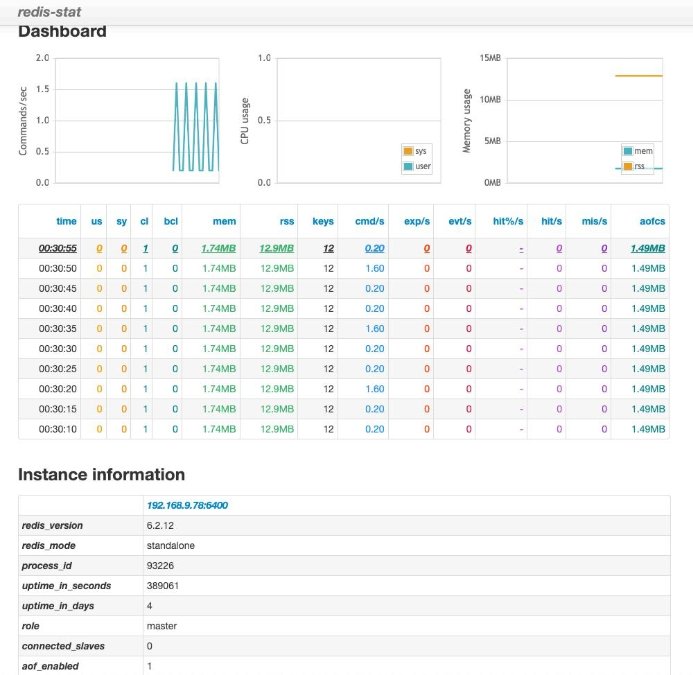
# web图形监控
./redis-stat 192.168.9.78:6400 192.168.9.78:6411 --server=9000 5 --daemon
# 访问地址:
http://192.168.9.78:9000/
# 如果使用gem或源码安装的时候,各种问题,很多,就别折腾了,直接看这块。
# 使用java版本,下载jar包
https://github.com/junegunn/redis-stat/releases/download/0.4.14/redis-stat-0.4.14.jar
# 命令行监控,执行jar包
java -jar redis-stat-0.4.14.jar --server 192.168.9.78:6400 192.168.9.78:6411 5
# 使用web页面监控
java -jar redis-stat-0.4.14.jar 192.168.9.78:6400 192.168.9.78:6411 5 --server=9000
# 访问地址
http://192.168.9.78:9000/