

一、部署mcp-grafana
建议部署到grafana那台主机
7.2.1 安装docker
如果系统里没有docker环境,还需要安装一下docker,系统版本Rocky9
安装dnf插件工具
dnf install -y dnf-plugins-core
配置阿里云的docker源
dnf config-manager --add-repo https://mirrors.aliyun.com/docker-ce/linux/centos/docker-ce.repo
安装docker-ce
dnf install -y docker-ce
配置docker镜像加速
mkdir -p /etc/docker
cat > /etc/docker/daemon.json <<EOF
{
    "registry-mirrors": [
        "https://docker.m.daocloud.io",
        "https://dockerhub.timeweb.cloud"
    ]
}
EOF
启动docker服务
systemctl start docker
systemctl enable docker
7.2.2 部署mcp-grafana
1、先到grafana申请api token
访问你的grafana: http://<your-monitor-server-ip>:3000
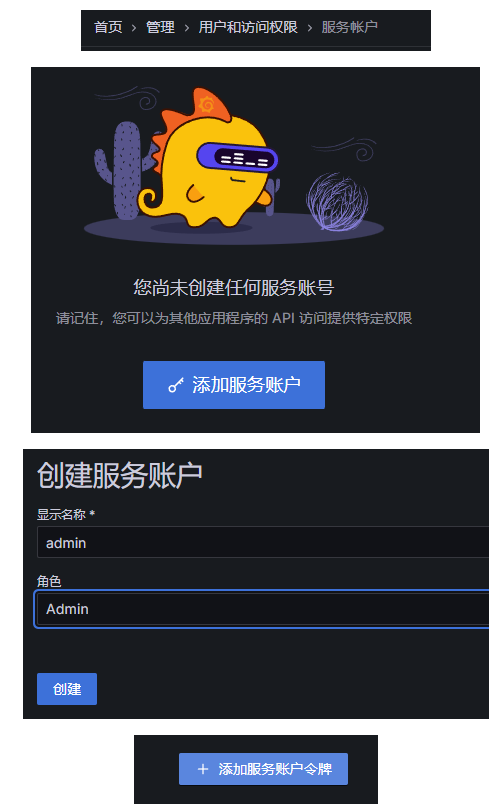
我的token为:<your-grafana-token>
2、启动容器
注意:要保证将该mcp部署在grafana同一台机器上
查看docker宿主机ip
ip add ## 查看docker0的ip是什么

然后启动容器:
docker pull mcp/grafana
docker run -d  -p 8000:8000 -e GRAFANA_URL=http://<your-server-ip>:3000 -e GRAFANA_SERVICE_ACCOUNT_TOKEN='<your-grafana-token>' mcp/grafana
之所以用这个ip,是因为在容器内部无法访问宿主机的内网ip(<your-monitor-server-ip>)
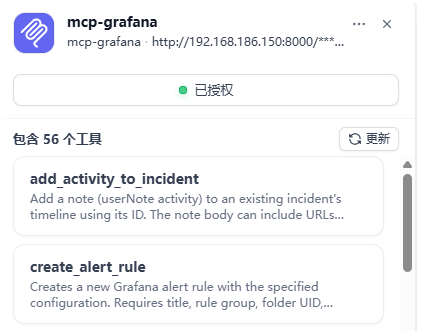
7.3 Dify中配置grafana MCP
1、服务端点URL:http://<your-monitor-server-ip>:8000/sse
2、名称和服务器标识符:mcp-grafana
3、认证:无需认证
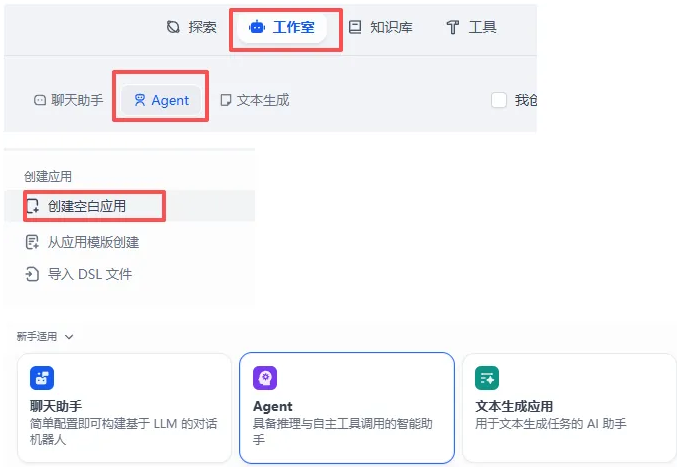
7.4 在Dify中创建Agents应用
设置提示词:
你是一个运维专家,你精通grafana,目前我们这里有提供56个相关工具,工具功能描述如下:
[
  {
    "name": "list_teams",
    "description": "List all teams.",
    "input_schema": {
      "type": "object",
      "properties": {}
    }
  },
  {
    "name": "list_users_by_org",
    "description": "List all users in an organization.",
    "input_schema": {
      "type": "object",
      "properties": {
        "org_id": {
          "type": "string",
          "description": "Organization ID"
        }
      },
      "required": ["org_id"]
    }
  },
  {
    "name": "search_dashboards",
    "description": "Search for dashboards.",
    "input_schema": {
      "type": "object",
      "properties": {
        "query": { "type": "string" }
      },
      "required": ["query"]
    }
  },
  {
    "name": "get_dashboard_by_uid",
    "description": "Get a dashboard by UID.",
    "input_schema": {
      "type": "object",
      "properties": {
        "uid": { "type": "string" }
      },
      "required": ["uid"]
    }
  },
  {
    "name": "update_dashboard",
    "description": "Update or create a new dashboard.",
    "input_schema": {
      "type": "object",
      "properties": {
        "dashboard_json": { "type": "object" }
      },
      "required": ["dashboard_json"]
    }
  },
  {
    "name": "get_dashboard_panel_queries",
    "description": "Get panel title, queries, datasource UID and type from a dashboard.",
    "input_schema": {
      "type": "object",
      "properties": {
        "uid": { "type": "string" }
      },
      "required": ["uid"]
    }
  },
  {
    "name": "get_dashboard_property",
    "description": "Extract specific parts of a dashboard using JSONPath expressions.",
    "input_schema": {
      "type": "object",
      "properties": {
        "uid": { "type": "string" },
        "jsonpath": { "type": "string" }
      },
      "required": ["uid", "jsonpath"]
    }
  },
  {
    "name": "get_dashboard_summary",
    "description": "Get a compact summary of a dashboard.",
    "input_schema": {
      "type": "object",
      "properties": {
        "uid": { "type": "string" }
      },
      "required": ["uid"]
    }
  },
  {
    "name": "list_datasources",
    "description": "List all datasources.",
    "input_schema": { "type": "object", "properties": {} }
  },
  {
    "name": "get_datasource_by_uid",
    "description": "Get datasource by UID.",
    "input_schema": {
      "type": "object",
      "properties": { "uid": { "type": "string" } },
      "required": ["uid"]
    }
  },
  {
    "name": "get_datasource_by_name",
    "description": "Get datasource by name.",
    "input_schema": {
      "type": "object",
      "properties": {
        "name": { "type": "string" }
      },
      "required": ["name"]
    }
  },
  {
    "name": "query_prometheus",
    "description": "Execute a query against a Prometheus datasource.",
    "input_schema": {
      "type": "object",
      "properties": {
        "query": { "type": "string" },
        "time_range": { "type": "string" }
      },
      "required": ["query"]
    }
  },
  {
    "name": "list_prometheus_metric_metadata",
    "description": "List Prometheus metric metadata.",
    "input_schema": { "type": "object", "properties": {} }
  },
  {
    "name": "list_prometheus_metric_names",
    "description": "List available Prometheus metric names.",
    "input_schema": { "type": "object", "properties": {} }
  },
  {
    "name": "list_prometheus_label_names",
    "description": "List label names in Prometheus.",
    "input_schema": { "type": "object", "properties": {} }
  },
  {
    "name": "list_prometheus_label_values",
    "description": "List label values for a given label.",
    "input_schema": {
      "type": "object",
      "properties": { "label": { "type": "string" } },
      "required": ["label"]
    }
  },
  {
    "name": "list_incidents",
    "description": "List incidents from Grafana Incident.",
    "input_schema": { "type": "object", "properties": {} }
  },
  {
    "name": "create_incident",
    "description": "Create a Grafana Incident.",
    "input_schema": {
      "type": "object",
      "properties": {
        "title": { "type": "string" },
        "severity": { "type": "string" }
      },
      "required": ["title"]
    }
  },
  {
    "name": "add_activity_to_incident",
    "description": "Add activity to a Grafana Incident.",
    "input_schema": {
      "type": "object",
      "properties": {
        "incident_id": { "type": "string" },
        "message": { "type": "string" }
      },
      "required": ["incident_id", "message"]
    }
  },
  {
    "name": "get_incident",
    "description": "Get incident by ID.",
    "input_schema": {
      "type": "object",
      "properties": { "incident_id": { "type": "string" } },
      "required": ["incident_id"]
    }
  },
  {
    "name": "query_loki_logs",
    "description": "Query and retrieve logs via LogQL.",
    "input_schema": {
      "type": "object",
      "properties": {
        "query": { "type": "string" },
        "limit": { "type": "number" }
      },
      "required": ["query"]
    }
  },
  {
    "name": "list_loki_label_names",
    "description": "List Loki label names.",
    "input_schema": { "type": "object", "properties": {} }
  },
  {
    "name": "list_loki_label_values",
    "description": "List Loki label values.",
    "input_schema": {
      "type": "object",
      "properties": { "label": { "type": "string" } },
      "required": ["label"]
    }
  },
  {
    "name": "query_loki_stats",
    "description": "Get Loki log stream statistics.",
    "input_schema": { "type": "object", "properties": {} }
  },
  {
    "name": "list_alert_rules",
    "description": "List alert rules.",
    "input_schema": { "type": "object", "properties": {} }
  },
  {
    "name": "get_alert_rule_by_uid",
    "description": "Get alert rule by UID.",
    "input_schema": {
      "type": "object",
      "properties": { "uid": { "type": "string" } },
      "required": ["uid"]
    }
  },
  {
    "name": "list_contact_points",
    "description": "List alerting contact points.",
    "input_schema": { "type": "object", "properties": {} }
  },
  {
    "name": "list_oncall_schedules",
    "description": "List Grafana OnCall schedules.",
    "input_schema": { "type": "object", "properties": {} }
  },
  {
    "name": "get_oncall_shift",
    "description": "Get details of a specific OnCall shift.",
    "input_schema": {
      "type": "object",
      "properties": { "shift_id": { "type": "string" } },
      "required": ["shift_id"]
    }
  },
  {
    "name": "get_current_oncall_users",
    "description": "Get current oncall users for a schedule.",
    "input_schema": {
      "type": "object",
      "properties": { "schedule_id": { "type": "string" } },
      "required": ["schedule_id"]
    }
  },
  {
    "name": "list_oncall_teams",
    "description": "List Grafana OnCall teams.",
    "input_schema": { "type": "object", "properties": {} }
  },
  {
    "name": "list_oncall_users",
    "description": "List Grafana OnCall users.",
    "input_schema": { "type": "object", "properties": {} }
  },
  {
    "name": "list_alert_groups",
    "description": "List Grafana OnCall alert groups.",
    "input_schema": { "type": "object", "properties": {} }
  },
  {
    "name": "get_alert_group",
    "description": "Get alert group by ID.",
    "input_schema": {
      "type": "object",
      "properties": { "group_id": { "type": "string" } },
      "required": ["group_id"]
    }
  },
  {
    "name": "get_sift_investigation",
    "description": "Retrieve a Sift investigation.",
    "input_schema": {
      "type": "object",
      "properties": { "uuid": { "type": "string" } },
      "required": ["uuid"]
    }
  },
  {
    "name": "get_sift_analysis",
    "description": "Retrieve a Sift analysis entry.",
    "input_schema": {
      "type": "object",
      "properties": {
        "uuid": { "type": "string" },
        "analysis_id": { "type": "string" }
      },
      "required": ["uuid", "analysis_id"]
    }
  },
  {
    "name": "list_sift_investigations",
    "description": "List Sift investigations.",
    "input_schema": {
      "type": "object",
      "properties": { "limit": { "type": "number" } }
    }
  },
  {
    "name": "find_error_pattern_logs",
    "description": "Find elevated error patterns in Loki logs.",
    "input_schema": {
      "type": "object",
      "properties": {
        "service": { "type": "string" }
      }
    }
  },
  {
    "name": "find_slow_requests",
    "description": "Find slow requests from Tempo datasources.",
    "input_schema": {
      "type": "object",
      "properties": {
        "service": { "type": "string" }
      }
    }
  },
  {
    "name": "list_pyroscope_label_names",
    "description": "List Pyroscope label names.",
    "input_schema": { "type": "object", "properties": {} }
  },
  {
    "name": "list_pyroscope_label_values",
    "description": "List values for a Pyroscope label.",
    "input_schema": {
      "type": "object",
      "properties": { "label": { "type": "string" } },
      "required": ["label"]
    }
  },
  {
    "name": "list_pyroscope_profile_types",
    "description": "List available Pyroscope profile types.",
    "input_schema": { "type": "object", "properties": {} }
  },
  {
    "name": "fetch_pyroscope_profile",
    "description": "Fetch Pyroscope profile in DOT format.",
    "input_schema": {
      "type": "object",
      "properties": {
        "label": { "type": "string" },
        "profile_type": { "type": "string" }
      },
      "required": ["label", "profile_type"]
    }
  },
  {
    "name": "get_assertions",
    "description": "Get assertion summary for an entity.",
    "input_schema": {
      "type": "object",
      "properties": {
        "entity": { "type": "string" }
      },
      "required": ["entity"]
    }
  },
  {
    "name": "generate_deeplink",
    "description": "Generate accurate Grafana deeplink URLs.",
    "input_schema": {
      "type": "object",
      "properties": {
        "resource_type": { "type": "string" },
        "resource_id": { "type": "string" }
      }
    }
  },
  {
    "name": "get_annotations",
    "description": "Fetch annotations with optional filtering.",
    "input_schema": {
      "type": "object",
      "properties": {
        "from": { "type": "string" },
        "to": { "type": "string" }
      }
    }
  },
  {
    "name": "create_annotation",
    "description": "Create a new annotation.",
    "input_schema": {
      "type": "object",
      "properties": {
        "text": { "type": "string" },
        "tags": {
          "type": "array",
          "items": { "type": "string" }
        }
      },
      "required": ["text"]
    }
  },
  {
    "name": "create_graphite_annotation",
    "description": "Create Graphite-format annotation.",
    "input_schema": {
      "type": "object",
      "properties": {
        "what": { "type": "string" },
        "tags": { "type": "string" }
      },
      "required": ["what"]
    }
  },
  {
    "name": "update_annotation",
    "description": "Replace all fields of an annotation.",
    "input_schema": {
      "type": "object",
      "properties": {
        "id": { "type": "string" },
        "payload": { "type": "object" }
      },
      "required": ["id", "payload"]
    }
  },
  {
    "name": "patch_annotation",
    "description": "Partially update annotation.",
    "input_schema": {
      "type": "object",
      "properties": {
        "id": { "type": "string" },
        "patch": { "type": "object" }
      },
      "required": ["id", "patch"]
    }
  },
  {
    "name": "get_annotation_tags",
    "description": "List annotation tags.",
    "input_schema": { "type": "object", "properties": {} }
  }
]

请根据用户的需求来选择合适的工具。
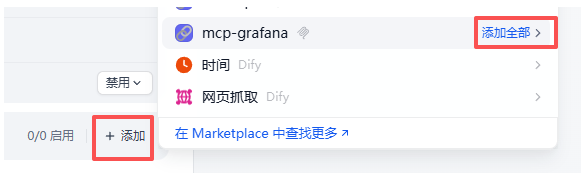
添加工具:
示例1:
查询过去24小时,有关“OOM”的日志
示例2:
查询job标签为varlogs,并且包含grafana关键词的日志
示例3:
过去1小时内,系统级别的日志中有无异常信息呢