

一、为什么还需要 dcgm-exporter
node_exporter 能看到系统级指标,但看不到足够细的 GPU 运行细节。而大模型推理和训练最关心的常常是:
- GPU 利用率;
- 显存占用;
- 温度和功耗;
- 显卡级别的异常状态。
这些更适合交给 NVIDIA 的 dcgm-exporter。
二、安装 dcgm-exporter
前提条件是已经装好 NVIDIA 驱动。
示例环境基于 Ubuntu 22.04,可以先下载相关 deb 包:
wget https://developer.download.nvidia.cn/compute/cuda/repos/ubuntu2204/x86_64/datacenter-gpu-manager-4-cuda12_4.0.0_amd64.deb
wget https://developer.download.nvidia.cn/compute/cuda/repos/ubuntu2204/x86_64/datacenter-gpu-manager-4-core_4.0.0_amd64.deb
wget https://developer.download.nvidia.cn/compute/cuda/repos/ubuntu2204/x86_64/datacenter-gpu-manager-4-dev_4.0.0_amd64.deb
wget https://developer.download.nvidia.cn/compute/cuda/repos/ubuntu2204/x86_64/datacenter-gpu-manager-4-proprietary-cuda12_4.0.0_amd64.deb
wget https://developer.download.nvidia.cn/compute/cuda/repos/ubuntu2204/x86_64/datacenter-gpu-manager-4-proprietary_4.0.0_amd64.deb
wget https://developer.download.nvidia.cn/compute/cuda/repos/ubuntu2204/x86_64/datacenter-gpu-manager-exporter_4.0.1-1_amd64.deb
然后安装:
dpkg -i datacenter-gpu-manager*
三、启动并验证服务
可以直接启动服务:
systemctl start dcgm-exporter
如果当前环境不方便使用 systemd,也可以命令行启动:
dcgm-exporter >/tmp/dcgm-exporter.log 2>/tmp/dcgm-exporter.log &
然后访问本地指标:
curl http://localhost:9400/metrics
只要能返回 Prometheus 风格指标,说明 exporter 已经正常工作。
四、把 dcgm-exporter 接入 Prometheus
在 prometheus.yml 中新增一个 job:
- job_name: 'dcgm-exporter'
  static_configs:
    - targets: ['127.0.0.1:9400']
如果是远程机器,也建议写成占位形式,而不是保留真实 IP。
修改完成后重启 Prometheus,或者重新拉起进程。
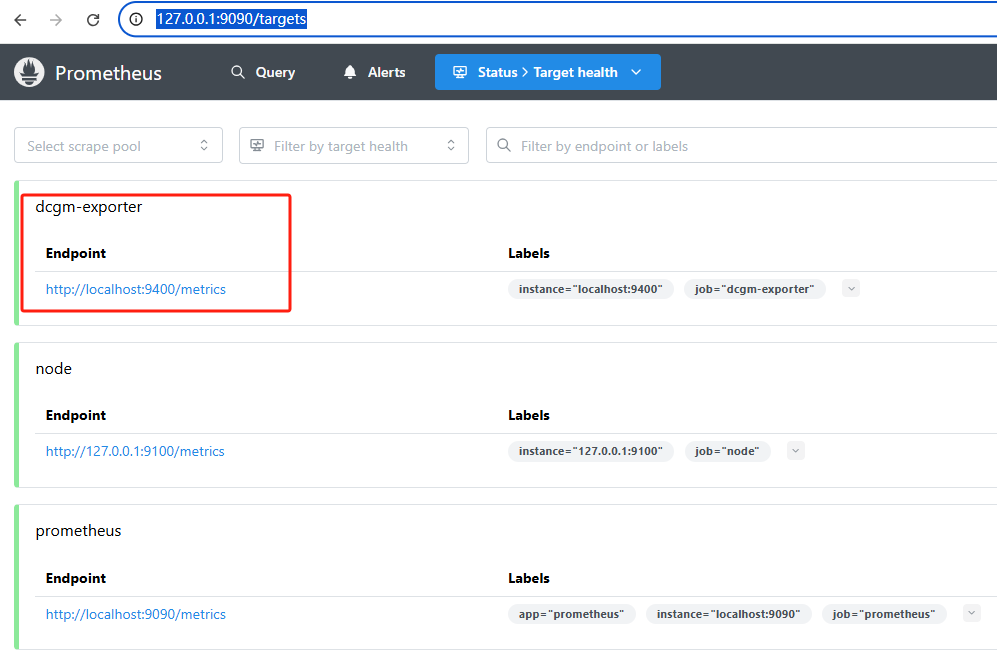
五、检查 Targets 是否生效
可以通过:
http://<your-prometheus-host>:9090/targets
查看 dcgm-exporter 是否已经被成功采集。
六、导入 Grafana 的 GPU 仪表盘
接下来就在 Grafana 里导入现成的大盘。
例如:
- Dashboard ID:
12239
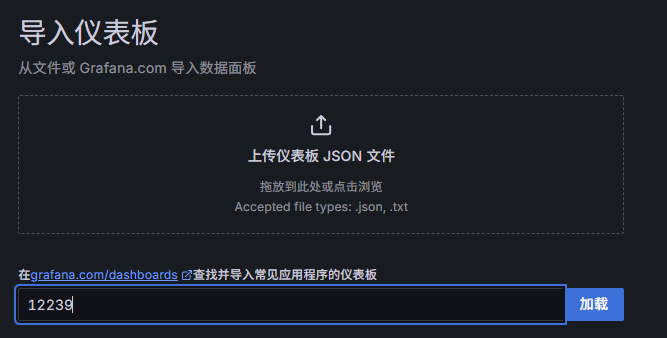
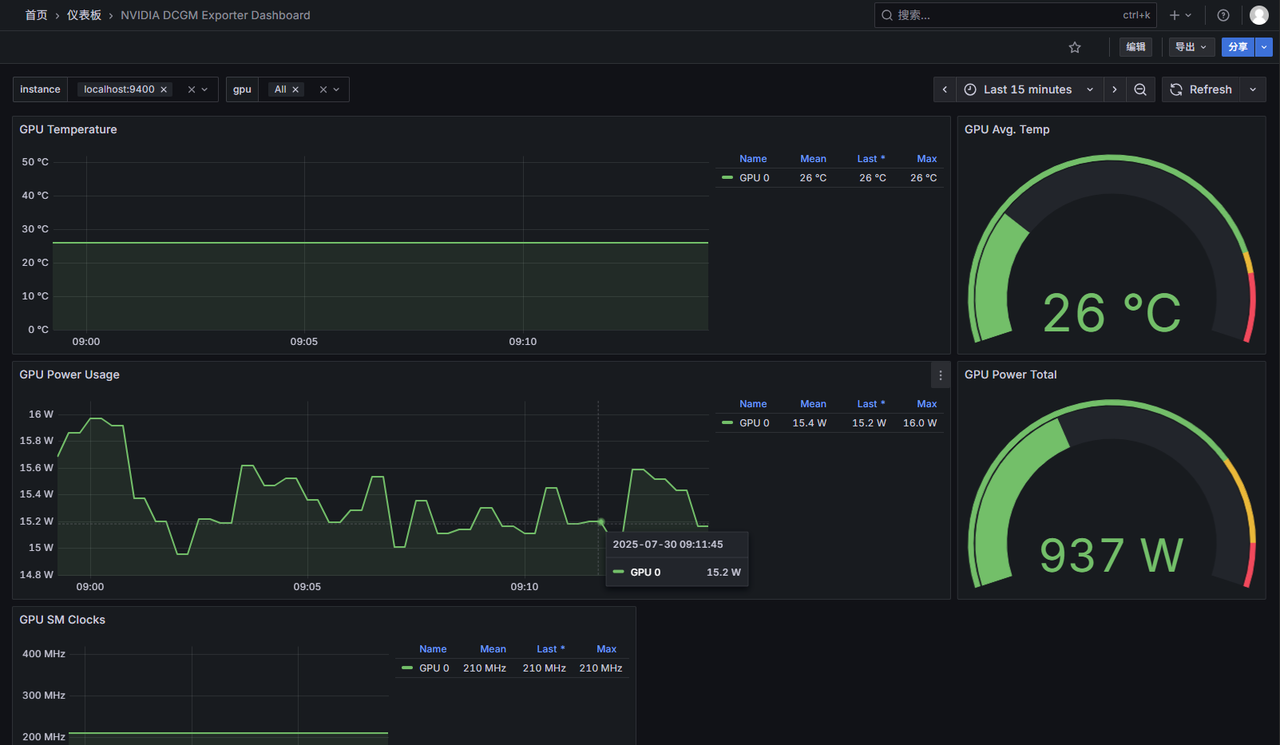
这样你就能得到更直观的 GPU 监控面板。
七、为什么这一步在大模型平台里很关键
对于训练和推理平台来说,GPU 才是最贵、最核心的资源。只有把显卡指标纳入 Prometheus + Grafana 体系里,你才真正具备了:
- 发现显卡是否吃满;
- 判断显存是否浪费;
- 观察温度和功耗异常;
- 给后续优化和扩容提供依据。
八、一个实用建议
如果你只做实验,用 nvidia-smi 足够;如果你做的是长期服务,就应该尽快补上 dcgm-exporter 这层。因为没有 GPU 可观测性,大模型平台的很多问题只能靠猜。